Lee de Mora

and 6 more

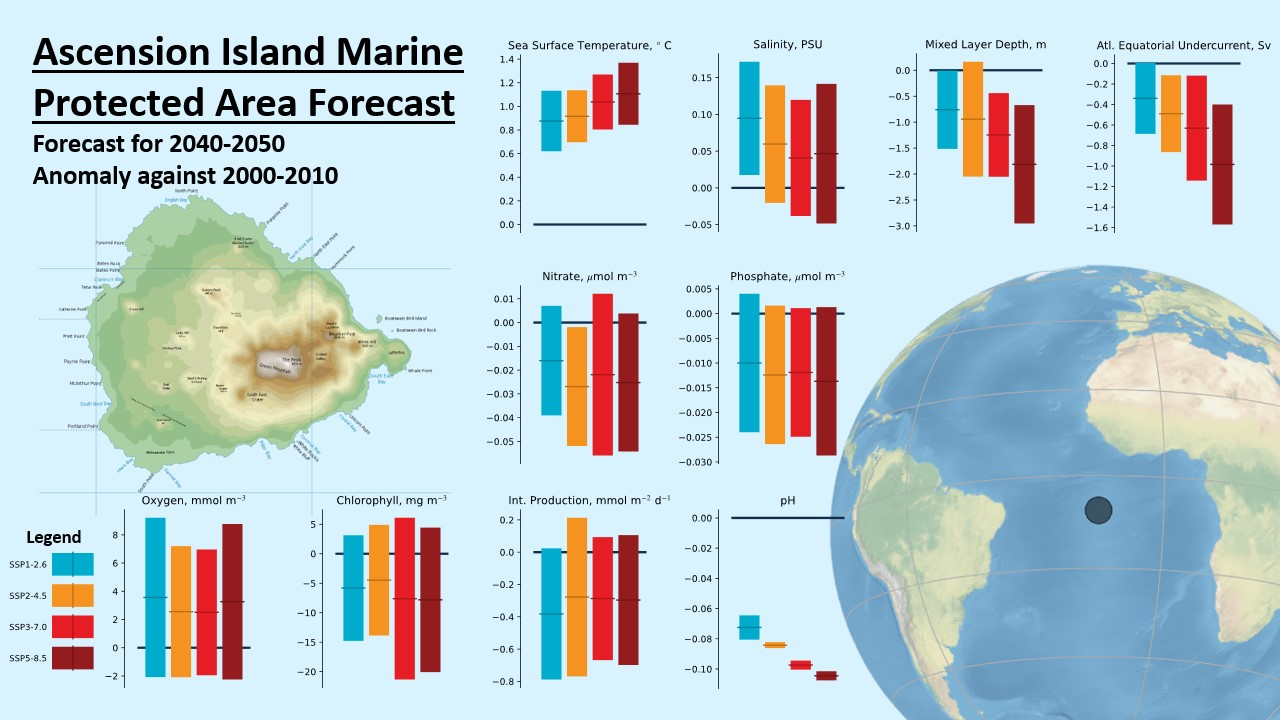
This is the first forecast of marine circulation and biogeochemistry for the Ascension Island Marine Protected Area (MPA). MPAs are a key management tools used to safeguard ocean biodiversity from human impacts, but their efficacy is increasingly threatened by anthropogenic climate change. To assess the vulnerability of individual MPAs to climate change and predict biological responses, it is first necessary to forecast how local marine environments will change. We found that the MPA will become warmer, more saline, more acidic, with less nutrients, less chlorophyll and less primary production by the mid-century. A weakening of the Atlantic equatorial undercurrent is forecast in all scenarios. In most cases, these changes are more extreme in the scenarios with higher greenhouse gases emissions and more significant climate change. The mean rise in temperature is between 0.9 \degree C and 1.2 \degree C over the first half of the 21st century. The integrated primary production and nutrients are forecast to decline in the MPA, but there is less consistency between models in projections of salinity, surface chlorophyll, and dissolved oxygen concentration at 500m depth. The combined effects of these projections may lead to changes in ecosystem services around Ascension Island. The effects of the model outputs were interpreted for three key ecosystem service providing habitats: biogenic deep sea habitats, intertidal sand and intertidal rocky shores. The outcomes were then used to assess potential effects on eight marine and coastal ecosystem services and information was compared to current ecosystem service levels.

Eric Saboya

and 17 more

Atmospheric trace gas measurements can be used to independently assess national greenhouse gas inventories through inverse modelling. Here, atmospheric nitrous oxide (N2O) measurements made in the United Kingdom (U.K.) and Republic of Ireland are used to derive monthly N2O emissions for 2013-2022 using two different inverse methods. We find mean U.K. emissions of 90.5±23.0 (1\(\sigma\)) and 111.7±32.1 (1\(\sigma\)) Gg N2O yr-1 for 2013-2022, and corresponding trends of -0.68±0.48 (1\(\sigma\)) Gg N2O yr-2 and -2.10±0.72 (1\(\sigma\)) Gg N2O yr-2, respectively for the two inverse methods. The U.K. National Atmospheric Emissions Inventory (NAEI) reported mean N2O emissions of 73.9 Gg N2O yr-1 across this period, which is 14-33% smaller than the emissions derived from atmospheric data. We infer a pronounced seasonal cycle in N2O emissions, with a peak occurring in the spring and a second smaller peak in the late summer for certain years. The springtime peak has a long seasonal decline that contrasts with the sharp rise and fall of N2O emissions estimated from the bottom-up U.K. Emissions Model (UKEM). Bayesian inference is used to minimize the seasonal cycle mismatch between the average top-down (atmospheric data-based) and bottom-up (process model and inventory-based) seasonal emissions at a sub-sector level. Increasing agricultural manure management and decreasing synthetic fertilizer N2O emissions reduces some of the discrepancy between the average top-down and bottom-up seasonal cycles. Other possibilities could also explain these discrepancies, such as missing emissions from NH3 deposition, but these require further investigation.