
1]
1]
Abstract. The very long, thin infared dark cloud “Nessie" is even longer than had been previously claimed, and an analysis of its Galactic location suggests that it lies directly in the Milky Way’s mid-plane, tracing out a highly elongated bone-like feature within the prominent Scutum-Centaurus spiral arm. Re-analysis of mid-infrared imagery from the Spitzer Space Telescope shows that this IRDC is at least 2, and possibly as many as 8 times longer than had originally been claimed by Nessie’s discoverers, \citet{Jackson2010}; its aspect ratio is therefore at least 150:1, and possibly as large as 800:1. A careful accounting for both the Sun’s offset from the Galactic plane (\(\sim 25\) pc) and the Galactic center’s offset from the \((l^{II},b^{II})=(0,0)\) position defined by the IAU in 1959 shows that the latitude of the true Galactic mid-plane at the 3.1 kpc distance to the Scutum-Centaurus Arm is not \(b=0\), but instead closer to \(b=-0.5\), which is the latitude of Nessie to within a few pc. Apparently, Nessie lies in the Galactic mid-plane. An analysis of the radial velocities of low-density (CO) and high-density (\({\rm NH}_3\)) gas associated with the Nessie dust feature suggests that Nessie runs along the Scutum-Centaurus Arm in position-position-velocity space, which means it likely forms a dense ‘spine’ of the arm in real space as well. No galaxy-scale simulation to date has the spatial resolution to predict a Nessie-like feature, but extant simulations do suggest that highly elongated over-dense filaments should be associated with a galaxy’s spiral arms. Nessie is situated in the closest major spiral arm to the Sun toward the inner Galaxy, and appears almost perpendicular to our line of sight, making it the easiest feature of its kind to detect from our location (a shadow of an Arm’s bone, illuminated by the Galaxy beyond). Although the Sun’s offset from the Galactic plane is not significant compared with the thickness of the plane as traced by Population I objects such as GMCs and HII regions, it may be significant compared with an extremely thin layer that might be traced out by Nessie-like objects. Future high-resolution extinction and molecular line data may therefore allow us to exploit the Sun’s position above the plane to gain a small amount of perspective on the Galactic disk.
Instructions for Co-Authors (will be deleted later–other readers please skip this section)
Still-needed text/contributions/thoughts from specific co-authors are marked with “xx."
The full file repository for this paper is at https://drive.google.com/#folders/0BxIRxiTe1u6BcGlnUGt2ckU1Vms, shared with all co-authors.
The “aas" (press conference) slides at https://drive.google.com/#folders/0BxIRxiTe1u6BRklQRzlUaUNuUUU.
The Mendeley Library “NessieandFriends” used to house references used in this work, at: http://www.mendeley.com/groups/2505711/nessie-and-friends/.
The Glue software used to intercompare data sets used in this work is online through: http://glueviz.org.
We are using http://Authorea.com as an experimental platform to compile this paper.
There are also some oddities in the Mendeley-generated .bib file (and alphabetization), so we will need to clean up the referencing and bibliography by hand when we submit this paper.
Determining the structure of the Milky Way, from our vantage point within, is a perpetual challenge for astronomers. We know the Galaxy has spiral arms, but it remains unclear exactly how many, cf. \citep{Vallee2008a}. Recent observations of maser proper motions give unprecedented accuracy in determining the three-dimensional position of the Galaxy’s center and rotation speed \citep{Reid2009,Brunthaler2011}. But, to date, we still do not have a definitive picture of the Milky Way’s three dimensional structure.
The analysis offered in this paper suggests that some infrared dark clouds (The term “Infrared Dark Cloud" or “IRDC" typically refers to any cloud which is opaque in the mid-infrared.) –in particular very long, very dark, clouds–appear to delineate the major features of our Galaxy as would be seen from outside of it. In particular, we study a \(>3^{\circ}\)-long cloud associated with the IRDC called “Nessie" \citep{Jackson2010} and we show that it appears to lie parallel to, and no more than just few pc from, the true Galactic Plane.
Our analysis uses diverse data sets, but it hinges on combining those data sets with a modern understanding of the meaning of Galactic coordinates. When, in 1959, the IAU established the current system of Galactic \((l,b)\) coordinates \citep{Blaauw1959}, the positions of the Sun with respect to the “true" Galactic disk, and of the Galactic Center, were not as well determined as they are now. As a result, the Galactic Plane is typically not at \(b=0\), as projected onto the sky. The exact offset from \(b=0\) depends on distance, as we explain in §[lookingdown]. Taking these offsets into account, one can profitably re-examine data relevant to the Milky Way’s 3D structure. The Sun’s vantage point slightly “above" the plane of the Milky Way offers useful perspective.
IRDCs are loosely defined as clouds with column densities high enough to be obvious as patches of significant extinction against the diffuse galactic background mid–infrared wavelengths. This implies that IRDCs are relatively starless: if they were to contain bright IR sources and nebulosity, they would not stand out as dark clouds. To give examples, \citet{Peretto2009a} draw the boundaries of IRDCs at an optical depth of 0.35 at \(8~\rm{}\mu{}m\) wavelength, equivalent to an \(\rm{}H_2\) column density \(\approx{}10^{22}~\rm{}cm^{-2}\). In their sample, clouds have average column densities of a few \(10^{22}~\rm{}cm^{-2}\) (e.g., Figure 2 of \citealt{peretto2010:irdcs-mass-density}). Some IRDCs do actively form high–mass stars (e.g., \citealt{pillai2006:g11} and \citealt{rathborne2007:irdc-msf}). It is therefore thought that some IRDCs are future sites of high–mass star formation. \citet{kauffmann2010:irdcs} demonstrate that most IRDCs are not massive and dense enough to form high–mass stars \citep{kauffmann2010:irdcs}. Still, they also argue that the few \(10^2\) most massive and dense clouds may contain a large fraction of the star–forming gas in the Milky Way. In that case, a small number of very dense and massive IRDCs may be responsible for a large fraction of the galactic star formation rate. The massive stars forming in these dense IRDCs are so bright, that extragalactic observers of the Milky Way might see IRDCs hosting young massive stars as the predominant mode of star formation here. Thus, if one can deduce the pattern of IRDCs that an observer outside the Milky Way would see, one can determine the Milky Way’s (non-dark-matter) structure, from inside. (CB Note: these last 2 sentences are interesting – does it contradict Jens’ claims made about star forming efficiencies in IRDCs? Jens: changed text to highlight that high–mass SF is limited to the most massive and dense IRDCs. Then the argument still holds that bright stars may trace IRDCs. If this is to hold for Nessie, this cloud should exceed the mass–size limit from \citep{kauffmann2010:irdcs}.)
The traditional ISM-based probes of the Milky Way’s structure have been HI and CO. Emission in these tracers gives line intensity as a function of velocity, so the position-position-velocity data resulting from HI and CO observations can give three dimensional views of the Galaxy, if a rotation curve is used to translate line-of-sight velocity into a distance. Unfortunately, though, the Galaxy is filled with HI and CO, so it is very hard to disentangle features when they overlap in velocity along the line of sight. Nonetheless, much of the basic understanding of the Milky Way’s spiral structure we have now comes from HI and CO observations of the Galaxy, much of it from the compilation of CO data presented by \citet{Dame2001}.
Recently, several groups have targeted high-mass star-forming regions in the plane of the Milky Way for high-resolution ISM observations. In their BeSSeL Survey, Reid et al. are using hundreds of hours of VLBA time to observe hundreds of regions for maser emission, which can give both distance and kinematic information for very high-density (\(n>10^8\) cm\(^{-3}\)) gas \citep{Reid2009,Brunthaler2011}. In the HOPS Survey, hundreds of positions associated with the dense peaks of infrared dark clouds have now been surveyed for \({\rm NH}_3\) emission \citep{Purcell2012b}, yielding high-spectral resolution velocity measurements towards gas whose density typically exceeds \(10^4\) cm\(^{-3}\). In follow-up spectral-line surveys to the ATLASGAL dust-based survey of the Galactic Plane \citep{Beuther2012a}, \citet{Wienen2012} have measured \({\rm NH}_3\) emission in nearly 1000 locations. The ThrUMMs Survey aims to map the entire fourth quadrant of the Milky Way in CO and higher-density tracers \citep{BarnesPeter2010}, which also holds the potential for more high-resolution velocity measurements.
Targets in the high-resolution velocity studies are usually identified based on continuum surveys, which show the locations of the highest column-density regions, either as extinction features (“dark clouds" in the optical, “IRDCs" in the infrared), as dust emission features (in surveys of the thermal infrared), or as gas emission features (e.g. HII regions).
Great power lies in the careful combination of continuum and spectral-line data when one wants to understand the structure of the ISM in three-dimensions. Thus, there have already been several efforts to combine dust maps with spectral-line data, whose goal is often the assignment of more accurate distances to particular clouds or regions e.g., \citep{Foster2012}. These improved distances allow for more reliable conversion of measured quantities (e.g. fluxes) to physical ones (e.g. mass).
In this study, our aim is to combine morphological information from large-scale mid-infrared continuum “dust" maps of the Galactic Plane with spectral-line data, so as to understand the nature of very long infrared dark clouds that appear parallel to the Galactic Plane. We focus in particular on the IRDC named “Nessie" in the study presented by \citet{Jackson2010}. In that 2010 paper, Nessie is shown to be a highly elongated filamentary cloud (see Figure [fig:FindingChart]) exhibiting the after-effects of a sausage instability that led to several massive-star-forming peaks spaced at regular intervals. We extend the work of Jackson et al. by first by literally “extending" the cloud, to a length of at least 3 degrees (§[longer]). In §[3D], we show that a careful accounting for the modern measures of the Sun’s height off of the Galactic mid-plane and of the true position of the Galactic Center imply that Nessie lies not just parallel to the Galactic Plane, but in the Galactic Plane. We consider what velocity-resolved measures of the material associated with Nessie tells us about its three-dimensional position in the Galaxy, and we conclude, in §[spine] that Nessie likely marks the “spine" of the Scutum-Centaurus arm of the Milky Way in which it lies. In §[future], we consider, in the light of coming computational and observational capabilities, the likelihood of finding more “Nessie-like" structures in the future, and of using them, in conjunction with the Sun’s vantage point just above the Plane of the Milky Way, to map out the skeleton of our Galaxy.
[
longer]
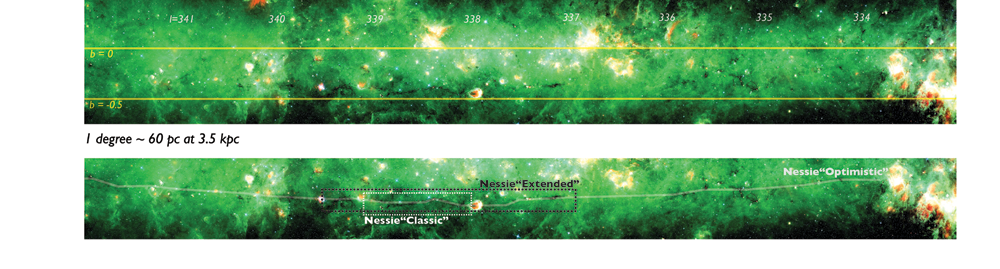
Nessie was discovered and named using Spitzer Space Telescope images that show the cloud as a very clear absorption feature at mid-infrared wavelengths \cite{Jackson2010}. Using observations of the dense-gas tracer HCN, Jackson et al. (2010) further show that the section of the cloud from \(l=337.85\) to \(339.1\) (labelled “Nessie Classic" in Figure [fig:FindingChart]) exhibits very similar line-of-sight velocities, ranging over \(-40<v_{LSR}<-36\) km s\(^{-1}\). The similarities of these line-of-sight velocities is taken to mean that the cloud is a coherent, long structure, and not a chance plane-of-the-sky projection of disconnected features. Thus, “Nessie Classic" is shown to be a dense, long (\(\sim 1^\circ\)), narrow (\(\sim 0.01^\circ\)), filament, and Jackson et al. (2010) ultimately conclude that it is undergoing a sausage instability leading to density peaks hosting active sites of massive star formation.
Our purpose in looking at Nessie again here is not to further analyze the star-forming nature of this cloud. Instead, our focus is on how long the full Nessie feature might be, and what its length might imply about its role in the Galaxy. Casual inspection of Spitzer imagery given in Figure [fig:FindingChart] suggests that Nessie is at least two or three times longer than “Nessie Classic," measuring at least \(3^\circ\) long (“Nessie-Extended"). Very careful inspection (pan and zoom Figure [fig:FindingChart]) of the Spitzer images suggests that Nessie could be even longer. If one optimistically connects what appear to be all the relevant pieces then “Nessie Optimistic" could be as much as \(9^\circ\) long (light white chalk line in Figure [fig:FindingChart]). The optimism involved in seeing the longest extent for Nessie could be warranted if bright star-forming regions have broken up the continuous extinction feature, and/or if the background emission fluctuates enough to make the extinction hard to detect.
Determining the physical, three-dimensional, nature of extensions to the Nessie cloud requires a detailed analysis of the velocity of the gas associated with the dust responsible for mid-IR extinction. We offer such an analysis below (§[3D]), but here we note that if Nessie (as is nearly certain given its velocity range) lies in or near the Scutum-Centaurus Arm of the Milky Way, then its distance is roughly 3.1 kpc (cf. Jackson et al. 2010). At that distance, Nessie Classic is roughly 80 pc long, Nessie Extended is 160 pc long, and Nessie Optimistic is 430 pc long. For any of these lengths, the dark filament’s width is of order 0.01 degrees (0.5 pc). Thus, clouds’s axial ratio is about 150 for Nessie Classic, 300 for Nessie Extended, and nearly three times more, 800, for Nessie Optimisitc. (These calculations are based on Table 1 a publicly-available interactive spreadsheet, at https://docs.google.com/spreadsheet/ccc?key=0AhIRxiTe1u6BdDlXOC10Zkd3WUNNZHVnRlhfeWhJYlE a snapshot of which is shown as Figure [fig:table1].)
image

image
[
3D]
[
lookingdown] Astronomers would love to travel far beyond the Milky Way, so that we could observe its spiral pattern face-on, as we do for other galaxies. But (the standard sad story goes) our Sun is so entrenched in the Milky Way’s plane that an “overhead view" of the Milky Way’s structure is impossible. Or is it? What if the Sun were just far enough above the Galactic Plane that we could use its height to give ourselves a tiny bit of perspective on the Galactic Plane that would spatially separate features–if they are very narrow–at different distances to be at different projected latitudes? Turns out we are lucky in this way–the Sun is apparently located a bit above the Plane (see below), and we can use that vantage point to out advantage.
To understand why most astronomers do not yet consider the possibility or value of an overhead view, we need to consider the origin of our current Galactic coordinate system, and our current understanding of the Sun’s and the Galactic Center’s 3D positions. Writing in 1959 on behalf of the International Astronomical Union’s (IAU’s) sub-commission 33b, Blaauw et al. wrote:
The equatorial plane of the new co-ordinate system must of necessity pass through the sun. It is a fortunate circumstance that, within the observational uncertainty, both the sun and Sagittarius A lie in the mean plane of the Galaxy as determined from hydrogen observations. If the sun had not been so placed, points in the mean plane would not lie on the galactic equator.
In a further explanation of the IAU system in 1960, Blaauw et al. explain that stellar observations did, at that time, indicate the Sun to be at \(z=22 \pm 2\) (22 pc above the plane), but the authors then discount those observations as too dangerously affected by hard-to-correct-for extinction in and near the Galactic Plane \citep{BlaauwA.1960}. Instead, the 1959 IAU system relies on the 1950’s measurements of HI, which showed the Sun to be at \(z=4\pm 12\) pc off the Plane, consistent with the Sun being directly in the Plane (\(z=0\)). Interestingly, since the 1950’s, the Milky Way’s HI layer has been shown to have corrugations on the scale of 10’s of pc \citep{Malhotra1995}, and there may be similar fluctuations in the mid-plane of the \({\rm H_2}\) \citep{Malhotra1994}, so it is still tricky to use gas measurements to determine the Sun’s height off the plane. xxBob/Tom D. – should we say more?xx
Astronomers today are still using the \((l^{II}, b^{II})\) Galactic coordinate system defined by \citet{Blaauw1959}, but it is not still the case, within observational uncertainty, that the Sun is in the mean plane of the Galaxy, and the true position of the Galactic Center is no longer at \((l^{II}=0, b^{II}=0)\). Instead, a variety of lines of evidence \citep{Chen2001b,Maiz-Apellaniz2001a,Juric2008a} show that the Sun is approximately 25 pc above the stellar Galactic mid-plane, and VLBA proper motion observations of masers show that the Galactic Center is about 7 pc below where the \((l^{II}, b^{II})\) system would put it \citep{Reid2004}. These offsets, as predicted by Blaauw et al., imply that “points in the mean plane [do] not lie on the galactic equator."
Figure [fig:galcoords] shows a schematic (not-to-scale) diagram of the effect of the Sun’s and the Galactic Center’s offsets from the mid-plane defined by the IAU in 1959 (and still in use as \((l^{II}, b^{II})\) today). The tilt of the “True" Galactic Plane to the presently IAU-defined Plane means that, within about 12 kpc of Sun (Note: Twelve kpc is the approximate distance where the True and IAU planes cross, on a line toward the Galactic Center. Along other directions toward the Inner Galaxy, it will be further to the crossing point, and toward the Outer Galaxy, the latitude of the Plane will always be negative.) any feature that is truly “in" the Galactic mid-plane will appear on the Sky at negative \(b^{II}\). Figure [fig:coloredlines] shows an example of this effect, where the rainbow-colored dashed line indicates the sky position of the “True" Galactic mid-plane at a Nessie-like distance of 3.1 kpc (assuming the the Sun is 25 pc off the plane, a distance to SrgA* of 8.4 kpc, a rotation speed for the Milky Way of 239 km s\(^{-1}\), and (U,V,W) motion for the Sun of 11.1, 12.4, and 7.2 km s\(^{-1}\), respectively).

image
Ever since velocity-resolved observations of stars and gas have been possible, astronomers have been modeling the rotation pattern of the Milky Way. Using a measured rotation curve for the Milky Way’s gas, e.g., \citep{McClureGriffiths2007}, one can translate observed LSR velocities to a unique distance in the Outer Galaxy, and to one of two possible (“Near" or “Far") distances toward the Inner Galaxy. Figure [fig:topview] shows iso-\(v_{LSR}\) contours toward the Inner Galaxy, around the longitude range of Nessie, superimposed on the data-driven cartoon of our current understanding of the Milky Way’s structure (xxBenjamin will suggest how to reference this work by Hurt, Benjamin, Dame, et al.xx). It is clear from Figure [fig:topview] why a Near-Far distance ambiguity exists, and also that velocities associated with the near-side of the Scutum-Centaurus Arm at Nessie’s longitude range should be near 40 km s\(^{-1}\).
Combining the modern measurements of the Sun’s height above the plane (\(z\sim 25\) pc), with the IAU galactic coordinate definitions as described in Figure [fig:topview], we can determine where the mid-Plane of the Galaxy should appear in the \((l^{II}, b^{II})\) system at any particular distance from the Sun. Figure [fig:coloredlines] shows where the Scutum-Centaurus Arm would appear on the Sky (for a distance to SrgA* of 8.4 kpc, a rotation speed for the Milky Way of 239 km s\(^{-1}\), and (U,V,W) motion for the Sun of 11.1, 12.4, and 7.2 km s\(^{-1}\), respectively). As its caption explains in detail, Figure [fig:coloredlines]’s colored lines are associated with the near part of the Scutum-Centaurus Arm (shown as short, yellow-greeen line segment in Figure [fig:topview]). For reference, white lines in Figure [fig:coloredlines] show the Sky position of the far part of the Scutum-Centaurus arm in the same longitude range (shown as a white chalk line in Figure [fig:topview]).
The dashed colored line in Figure [fig:coloredlines], indicating the predicted position of the Galactic Plane on the Sky at the distance to the near side of the Scutum-Centaurus Arm, passes almost directly through Nessie. Solid colored lines show 20 pc above and below the Plane at the distance to the Scutum-Centaurus Arm, so Figure [fig:coloredlines] makes it is very clear that Nessie lies within just a few pc of the Plane, along its entire length. This is either an extremely fortuitous coincidence, or an indication that Nessie is tracing a significant feature that lies “exactly" within the Galactic Plane.
(CB NOTE): We’ve all mentioned this before, but I think it should be in the paper: the location of Nessie within a few pc of the “mean” GP is both a suggestion that Nessie lies exactly in the plane and a coincidence. The plane is corrugated and wavy on 10pc scales according to the above text – thus even if Nessie is exactly in the local midplane, we are lucky that the local midplane lies so close to the global midplane (i.e. the thing that the rainbow line traces) near Nessie. I think it’s important to note that we understand this fact, lest a skeptic realize this as well and dismiss our argument

image

image
[
CO] CO observations trace gas with mean density around 100 cm\(^{-3}\). CO emission associated with the Scutum-Centaurus Arm of the Milky Way is shown in Figure [fig:COarm], which presents a plane-of-the-sky map integrated over \(-50 <v_{LSR}< -30\) km s\(^{-1}\). The velocity range is centered on -40 km s\(^{-1}\), the average velocity of the Scutum-Centaurus Arm in Nessie’s longitude range (see Figures [fig:topview] and [fig:coloredlines]). The white chalk line superimposed on Figure [fig:COarm] is the same tracing of “Nessie Optimistic" shown in Figure [fig:FindingChart]. The black feature labeled “Nessie" refers to “Nessie Classic."
The vertical (latitude) centroid of the CO emission attributed to the Scutum-Centaurus Arm \citep{Dame2011} shown in Figure [fig:COarm] appears to follow Nessie remarkably well, even out to the full \(8^\circ\) (430 pc) extent of Nessie Optimistic. Table 1 estimates Nessie’s typical \({\rm H_2}\) column density a \(\gtrsim 10^{23}\) cm\(^{-2}\) and its typical volume density at \(\gtrsim 10^5\) cm\(^{-3}\). Thus, the plane-of-the-sky coincidence of the line-of-sight-velocity-selected “Scutum-Centaurus" CO emission and the mid-IR extinction suggests that the Nessie IRDC may be a kind of “spine" or “bone" of this section of the Scutum-Centaurus Arm. But, the spatial resolution of the CO map is too low (\(8'\)), and the 20 km s\(^{-1}\) velocity range associated with the Arm in CO is too broad to decide based on this evidence alone whether Nessie is a well-centered “spine" or just a long skinny feature associated with, but potentially significantly inclined to, the Scutum-Centaurus Arm.
CB NOTE: This claims in the last paragraph could be tested statistically in a few different ways. The most obvious is to fit a moving-average regression line through the CO map, and confirm that this line (+ uncertainties) overlaps Nessie. The second test is to check whether the curvature in Nessie optimistic is present in the CO data (as the paragraph seems to suggest). One could do this by fitting a straight line through the CO data, and checking whether this is inconsistent with the first regression line. I agree that these will probably be weak tests given the intrinsic width of the CO data, but I would be in favor of some quantitative argument to back up the first sentence in the previous paragraph. I could run these tests if someone points me to the data used in the figure

image
[
ammonia] To estimate the 3D orientation of Nessie more precisely, we need to employ a gas tracer whose emission is sparser than CO’s in position-position-velocity space. Many recent studies have shown that IRDCs typically host over-dense blobs of gas (often called “clumps" or “cores") that provide the gaseous reservoirs for the formation for massive stars. Thus, several studies have been undertaken to survey IRDCs and their ilk for emission in molecular lines that trace high-density (\(\gg 10^3\) cm\(^{-3}\)), potentially star-forming, gas.
The H\(_2\)O Southern Galactic Plane (HOPS) Survey \citep{Purcell2012b} has surveyed hundreds of sites of massive star formation visible from the Southern Hemisphere for \({\rm NH}_3\) emission, which traces gas at densities \(n\gtrsim 10^4\) cm\(^{-3}\). The HOPS targets were selected based on H\(_2\)O maser emission, thermal molecular emission, and radio recombination lines, so as to include nearly all known regions of massive star formation within the surveyed area. These “massive-star-forming region" selection criteria mean that the HOPS database includes \({\rm NH}_3\) spectra for dozens of positions within the longitude range covered by Nessie.
Figure [fig:HOPSoverlay] shows an overlay of HOPS sources \({\rm NH}_3\)-determined LSR velocities on the Spitzer image of Nessie used throughout this paper (see Figures [fig:FindingChart] and [fig:coloredlines]). It is clear that the velocities of the HOPS sources within Nessie Extended (xxshould we show more length of Nessie?xx) agree remarkably well with what is predicted for the Scutum-Centaurus Arm (color-coding of dashed line). The velocities of sources at other latitudes within this longitude range do not agree, as they are not part of the Nessie feature, or, in most cases, not even associated with the (near-side of the) Scutum-Centaurus Arm (should we color-code the white lines, so we can show which of the higher \(b\) sources could be at the far part of the Arm? likely no, because the sensitivity of HOPS should not really see many of those?xx).
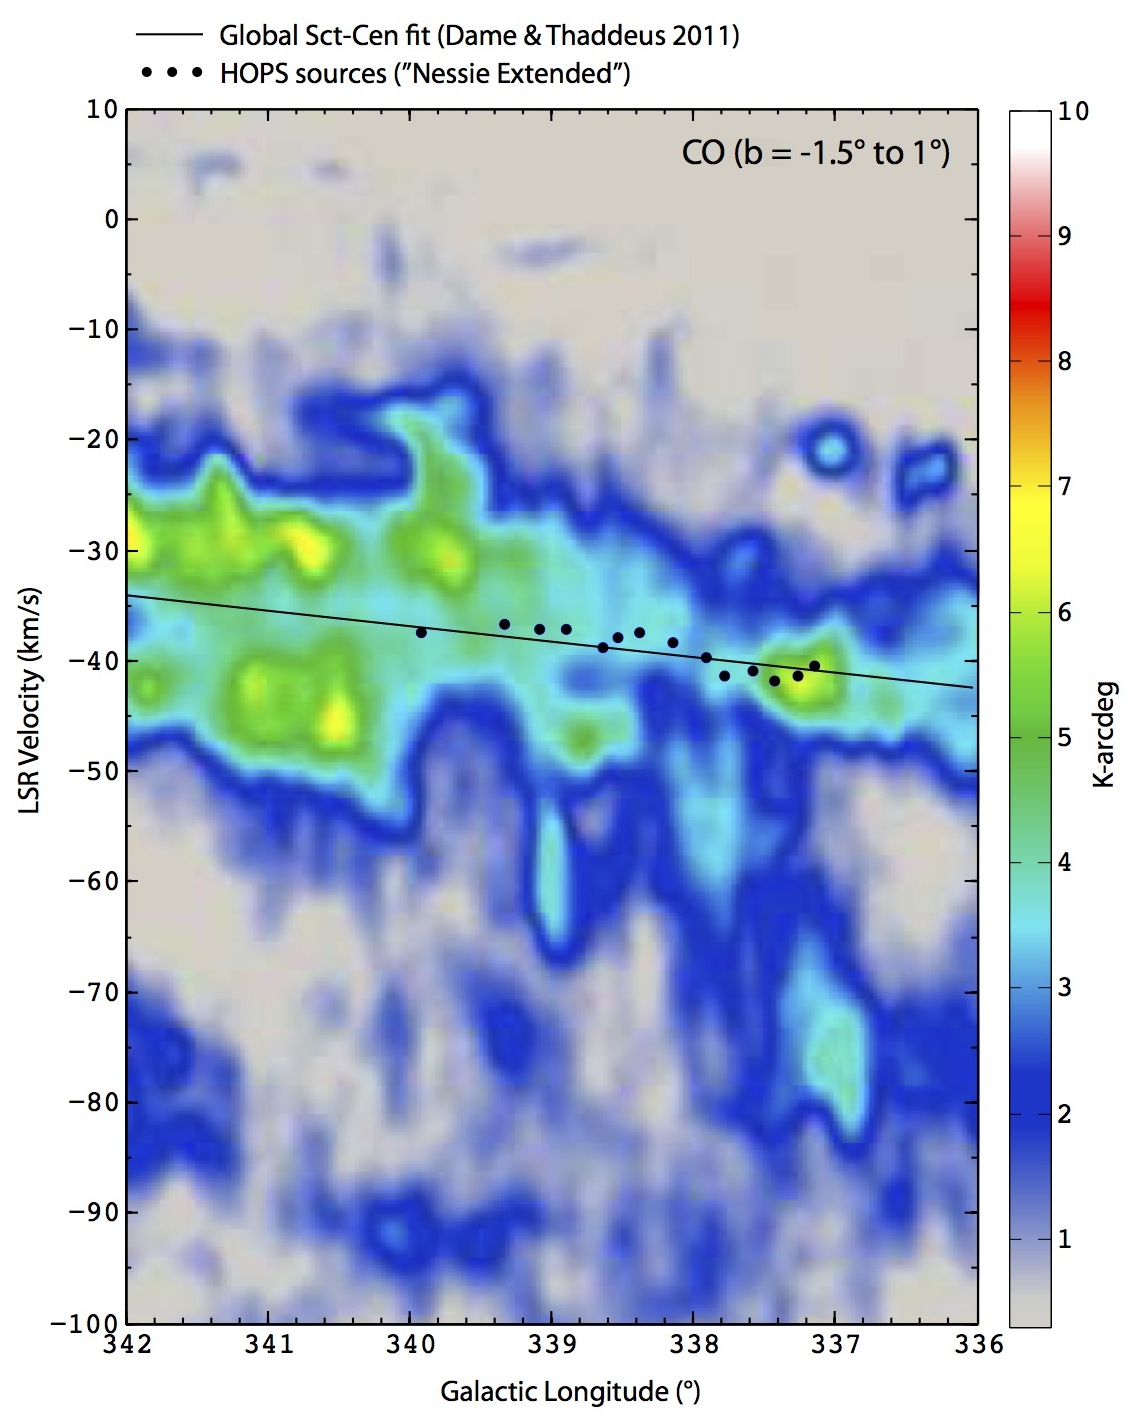
For the innermost part of Nessie (Nessie Classic), Jackson et al. (2010) had already noted a very narrow velocity range for dense gas associated with the IRDC, based on HCN observations. What is new here is the three-dimensional (latitude, longitude, and velocity) association of (an even longer) Nessie’s dense gas with predictions for where the centroid of the Milky Way’s Scutum-Centaurus Arm’s “middle" would lie. Figure [fig:pvdiagram], which offers a position-velocity diagram of CO and \({\rm NH}_3\) emission together, shows the association of the Nessie-HOPS sources with the Scutum Centaurus Arm most clearly.
What is most remarkable about Figure [fig:pvdiagram] is that the black line sloping through the figure is not a fit to the black dots representing the HOPS sources. Instead, that line indicated the position-velocity trace of the Scutum-Centaurus Arm based on \citep{Dame2011} data for the full Galaxy, not just this small longitude range. Figure [fig:pvdiagram] implies that Nessie goes right down the “spine" of the Scutum-Centaurus Arm, as best we can measure its position in CO position-velocity space.

image
image
[
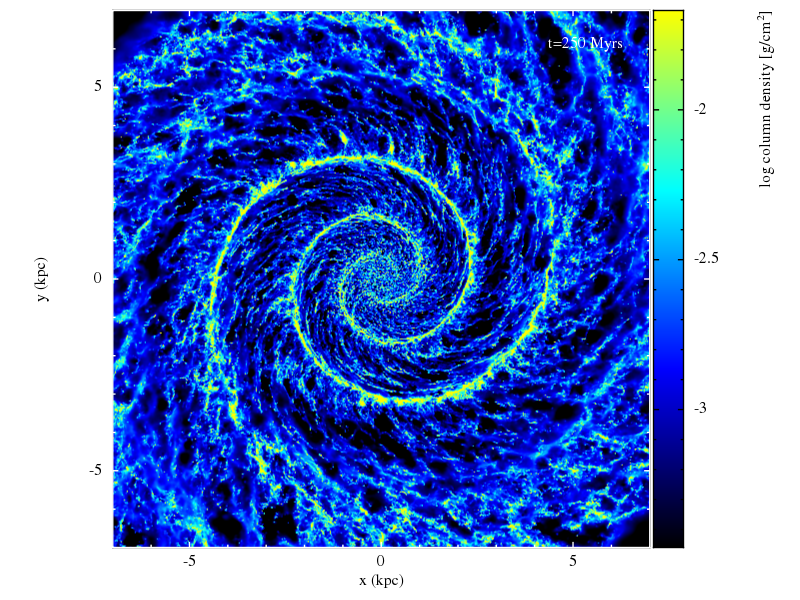
spine] All the evidence presented in this paper, taken together, strongly suggests that Nessie forms a spine-like feature that runs down the center of the Scutum-Centaurus Arm of the Milky Way. How did it get there? Is it the crest of a classic spiral density wave \citep{Lin1964}, or does it have some other cause? Any feature this long and skinny that is not controlled by Galactic-scale forces will be subject to a variety of instabilities, and cannot last long. It would be great if we could look to numerical simulations for answers, but today’s simulations can, alas, only give hints. Nessie is so skinny, and so much denser than its surroundings that no extant numerical simulation has the combination of spatial resolution and dynamic range in density needed to produce a feature like it.
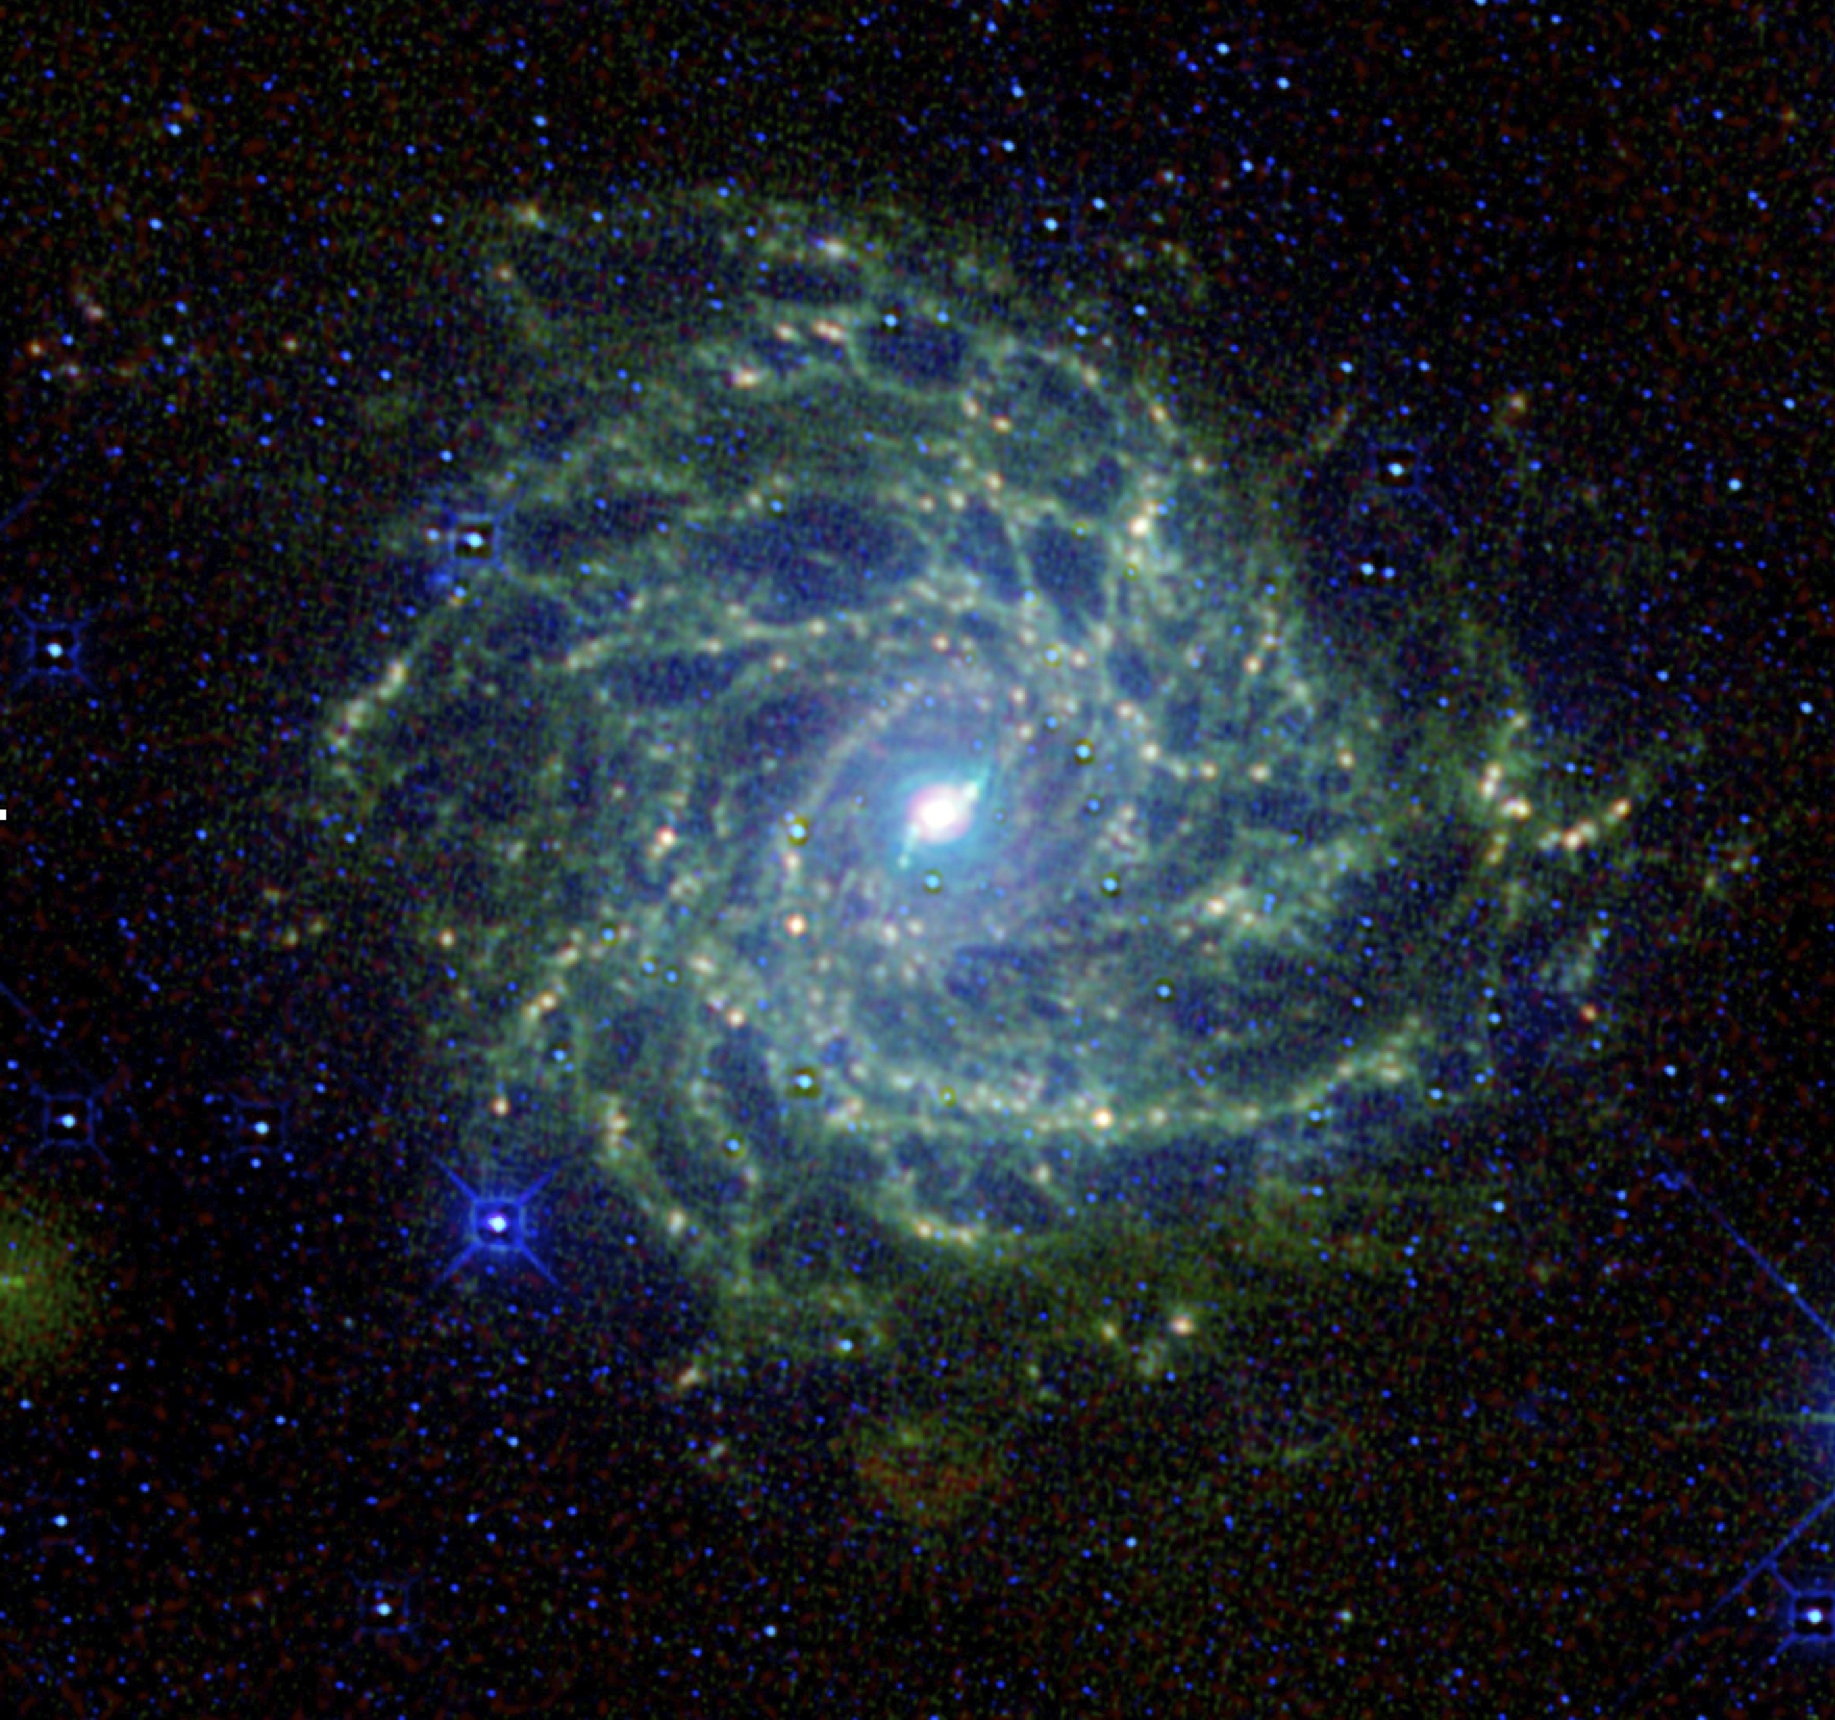
Figure [fig:simulation] offers a snapshot (available as a movie at xxURLxx) of a numerical simulation (xxAndi: what is right Dobbs et al. reference for simulation we are using, from http://empslocal.ex.ac.uk/people/staff/cld214/gmcs.html xx) that represents the state of the art at present. One can see density features that are highly elongated, both within the spiral arms, and also between the arms. Many of the features between the arms in Figure [fig:simulation] are similar to the ‘spurs’ and ‘feathers’ that have been simulated and observed by E. Ostriker and colleagues \citep{Shetty2006, Vigne2008, Corder2008}. Figure [fig:IC342] (discussed below) shows a recent WISE image of the galaxy IC342 \citep{Jarrett2013}, and it is clear from that image that some ‘spiral’ galaxies also exhibit inter-arm filaments that are even more pronounced than the simulated spurs and feathers.
In the case of Nessie, the velocity information analyzed in §[CO] and [ammonia] seems to very strongly favor Nessie’s being oriented exactly along (within, as the backbone of) an arm (Scutum-Centaurus) over the idea that Nessie is a spur or interam filament.
[
Andi Burkert will further discuss the current limitations on simulation resolution ... why can’t we simulate Nessies yet? Andi will also say more about the Dobbs’ simulation’s parameters and findings.]
The mass of Nessie under various assumptions is given in Table 1. If one counts just the IRDC (infrared-opaque) part of Nessie, and so assumes a mean density for the absorbing material of \(10^5\) cm\(^{-3}\), then Nessie Classic is \(4 \times 10^5\) M\(_\odot\), Nessie Extended is \(8 \times 10^5\) M\(_\odot\) and Nessie Optimistic is \(2 \times 10^6\) M\(_\odot\). If one assumes that the envelope traced by the HCN observations of Jackson et al. (2010) for Nessie Classic continues along Nessie’s length, then the mass of a \(n\sim 10^3\) cm\(^{-3}\) cylindrical tube (see Table 1) associated with Nessie would be \(1.5 \times 10^6\) M\(_\odot\) for Classic and \(4 \times 10^6\) M\(_\odot\) for Optimistic. For the Optimistic case, this mass amounts to 1/30,000th of the total baryonic mass (assuming \(\sim 10^{11}\) M\(_\odot\) total) of the Milky Way, meaning that of order 1000’s of additional Nessie-like features should be discoverable, if they exist.
image
[
future]
[
This section discusses the potential of combining the “perspective" offered by the Sun’s height off the plane with very high resolution, multi-band observations like what’s given here to map out the full skeleton of the Milky Way. Joao Alves will comment on extinction and Herschel-like emission maps. Jens Kauffmann will also add comments.]
In an ideal Universe, we would be able to travel far enough outside of the Milky Way to observe it from “outside," the way that we see, for example, Andromeda. The story for years has gone that generating an observationally-based plan (overhead) view of the Milky Way is impossible, because we are “in" the Plane. It is if Earth-bound astronomers have been living in the 2D world Edwin A. Abbott famously called ‘Flatland \citep{Abbott2008} when it comes to thinking about how to image the Milky Way’s spiral structure. But, we can escape Flatland by realizing that the tiny offset of the Sun above the Milky Way’s midplane can give us a tiny, but useful, bit of perspective on the 3D structure of the Milky Way, and it can offer a (highly-foreshortened!) overhead view. This perspective is only useful when looking at very sharp, very narrow, features like Nessie, because puffier, more standard, arm-defining features will overlap too much to be separated in a very foreshortened view.
Carry out the following thought experiment. Draw a rough plan of a spiral galaxy on a piece of paper. Position a vantage point a tiny distance (a few hundredths of an inch) above that piece of paper, about two-thirds of the way out from the center of the galaxy. Now give the observer at that vantage point super-sharp eyesight and ask if the observer can separate the spiral arm features you drew, as they observe them. They can–if and only if the spiral you drew has very narrow features defining its arms. If the observer were exactly in the piece of paper (living in Flatland), separating the arms would be impossible, regardless of their width. We are, like your observer, are at a tiny, tiny, elevation off of a spiral galaxy, and our visiion is good enough to separate very skinny arm-like features.
So, how might we use out vantage point above the Plane to map out more of the Milky Way’s skeleton? It turns out that Nessie is located in a place where seeing a very long IRDC projected parallel to the Galactic Plane should be just about the easiest, so it is not surprising that we found it first. Look again at Figure [fig:topview], and consider Nessie’s placement there (the yellow-green line). According to the current (data-based cartoon) view of the Milky Way shown in Figure [fig:topview], Nessie is in the closest major spiral arm (Scutum-Centaurus) to us, along a direction toward, but not exactly toward, the (confusing) Galactic Center. Nessie’s placement there means that it will have a bright background illumination as seen from futhrer out in the Galaxy (e.g. from the Sun), and that it will have a long extent on the Sky as compared with more distant or less perpendicular-to-our-line-of-sight objects.
To find more ‘Nessies,’ if such narrow features are in fact typical in spiral arms, we need to be clever about where and how we look. Our current understanding of the Milky Way’s spatial and velocity structure will allow us to draw more velocity-encoded lines like the ones shown in Figure [fig:coloredlines] on the Sky, mapping out the whole Galaxy as seen from the Sun’s vantage point. Once this drawing is done, we should design algorithms to look for dust clouds elongated (roughly) along those lines, and then we should examine the velocity structure of the elongated features, as we do in §[3D], above. Of course, we need to be flexible in which features we accept as possible other “bones," remembering that the model we will use to draw the expected features on the Sky is the same one we seek to refine! It is likely that a Bayesian approach, using the extant Milky Way model as a prior, will succeeed in this way.
As extinction [xxJoaoxx] and dust emission [xx Tom R., Jensxx]data cover more and more of the sky at ever-improving resolution and sensitivity, we should be able to map more and more of the Milky Way’s skeleton.
Recent (e.g. Spitzer, Herschel) mid- and far-infrared imagery already suggests that: 1) not all galaxies once thought to be dominated by a spiral pattern really are; and 2) not all IRDCs are likely to be part of the Milky Way’s skeleton.
As mentioned above, images like Figure [fig:IC342] clearly show that spiral galaxies can be very web-like, with long, straight filaments interconnecting spiral arms. [xxJens–add comments about dark lanes in other galaxies near here.xx] Thus, some of the features seen as long, skinny, IRDCs in the Milky Way could very well not be part of spiral arms, even if they are part of a Galaxy-wide structural pattern. This possibility will clearly complicate the modeling discussed above, but that just makes it more interesting! New data from ever-deeper and ever-sharper extragalactic observations will likely reveal even more complex galaxy strucutres. Combining ALMA thermal dust emission and molecular line observations of slightly-inclined galaxies will allow us to combine structural image with velocity information facilitating ever-improving model comparison.
Over the past 15 years, since their discovery, there have been many efforts to catalog and characterize IRDCs, and it is clear that not all IRDCs are, or should be, part of Nessie-like bones.
The catalog compiled by \citet{Peretto2009a} lists 11,000 IRDCs, but none of the features cataloged will be Nessie-like on its own. The structure-finding algorithm used in the Peretto & Fuller work is biased toward finding core-like roundish peaks, so a cloud like Nessie forms a connect-the-dots pattern (xxcould show figure like the one in WWT Tour with all the dots?xx) in the Peretto & Fuller catalog. In fact, Nessie is comprised of xxroughly 35xx Peretto & Fuller sources. So, while the Peretto & Fuller catalog is tremendously useful to the study of the properties of massive star forming cores, it will only become useful for finding “bones" when someone applies a clever dot-connecting algorithm to it, and its ilk.
Some very large, and/or very extended, IRDCs, such as the so-called “Massive Molecular Filament" studied by \citet{Battersby} xxdetails from Jens or AGxx, are not located along the plane-of-the-sky projected spiral arms. These clouds, which are probably just massive star-forming regions near but not exactly in the Galactic plane, do not appear as straight or highly-elongated as Nessie, and they may offer a hint at what threshold to set in looking for elongated features as we search for more bones. Futher, once numerical galaxy-simulation modeling resolution catches up to observational resolution, models should be able to say whether they other, non-bone-like, massive IRDCs had their origins long ago in bones, or form in some other way.
xx(and any other relevant new work?)xx
image
xxDo we need a separate concluding section?xx
This paper was a truly a group effort, and the author list includes only some of the many people who have contributed to it. The entire project was inspired by a question: “Is Nessie parallel to the Galactic Plane?," asked by Andi Burkert at the 2012 Early Phases of Star Formation (EPoS) meeting at the Max Planck Society’s Ringberg Castle in Bavaria. Three EPoS attendees beyond the author list contributed significant ideas and data to this work, most notably Steven Longmore, Eli Bressert, and Henrik Beuther. We are grateful to Cormac Purcell for giving us advance online access to the HOPS data, and to Mark Reid for generously sharing his expertise on Galactic structure. The text here was largely written by Alyssa Goodman; the theoretical ideas come primarily from Andi Burkert; and much of the geometrical analysis was carried out by Christopher Beaumont, Bob Benjamin, and Tom Robitaille. Tom Dame and Bob Benjamin provided expertise on Galactic structure, and they created several of the figures shown here. Jens Kauffmann provided expertise on IRDCs, and also was first to point out the potential relevance of the Sun’s non-zero height above the Galactic Plane. Joao Alves provided expertise on the potential for using extinction maps to find more Nessie-like features, and Michelle Borkin was instrumental in early visualization work that led to our present proposals for using the Sun’s “high" vantage point to map out the Milky Way. Jim Jackson contributed critical expertise on the Nessie IRDC, based both on the 2010 study he led and on unpublished work since. xxacknowledge NSF and NASAxx xxAdd here or in appropriate funding blurb spot: “M. Borkin was supported by the Department of Defense through the National Defense Science & Engineering Graduate Fellowship (NDSEG) Program.” xx
(xxcheck current ApJ format, namesxx) MOPRA, CfA Mini, Spitzer Space Telescope.