Early peopling of Brazil’s Northeast region (BRN) took place under an intimate relationship between humans and water scarcity, as the region, especially the state of Ceará (CE), has dealt historically with severe drought events since the 1800’s, which commonly led to catastrophic impacts of mass migration and deaths of thousands of people. Throughout the last century, the so-called “Droughts Polygon” region experienced intense infrastructural development, with the expansion of a dense network of reservoirs. This resulted in the evolution of a complex hydrologic system requiring a holistic investigation in terms of its hydrologic tradeoffs. This paper presents a parsimonious hydrologic modeling approach to investigate the 100-year (1920-2020) evolution of a dense surface-water network in the 24,500 km² Upper Jaguaribe Basin, with the ultimate goal of generating insights into the coevolution of a tightly coupled human-water system. Our model is driven by both climatic and human inputs, while model structure is allowed to evolve over time to dynamically mimic evolution of population size, reservoir count and water demand. Hundred years of continuous growth in storage capacity experienced within the UJ Basin is found to reflect the transition from complete vulnerability to droughts to achievement of significantly increased levels of water security. However, drought severity had in the meantime disproportionally intensified in this period, especially in reservoirs of medium to small capacities. Our analysis results have generated valuable insights into the different roles that reservoir expansion has played in securing the stability of human settlement patterns in drought prone regions.
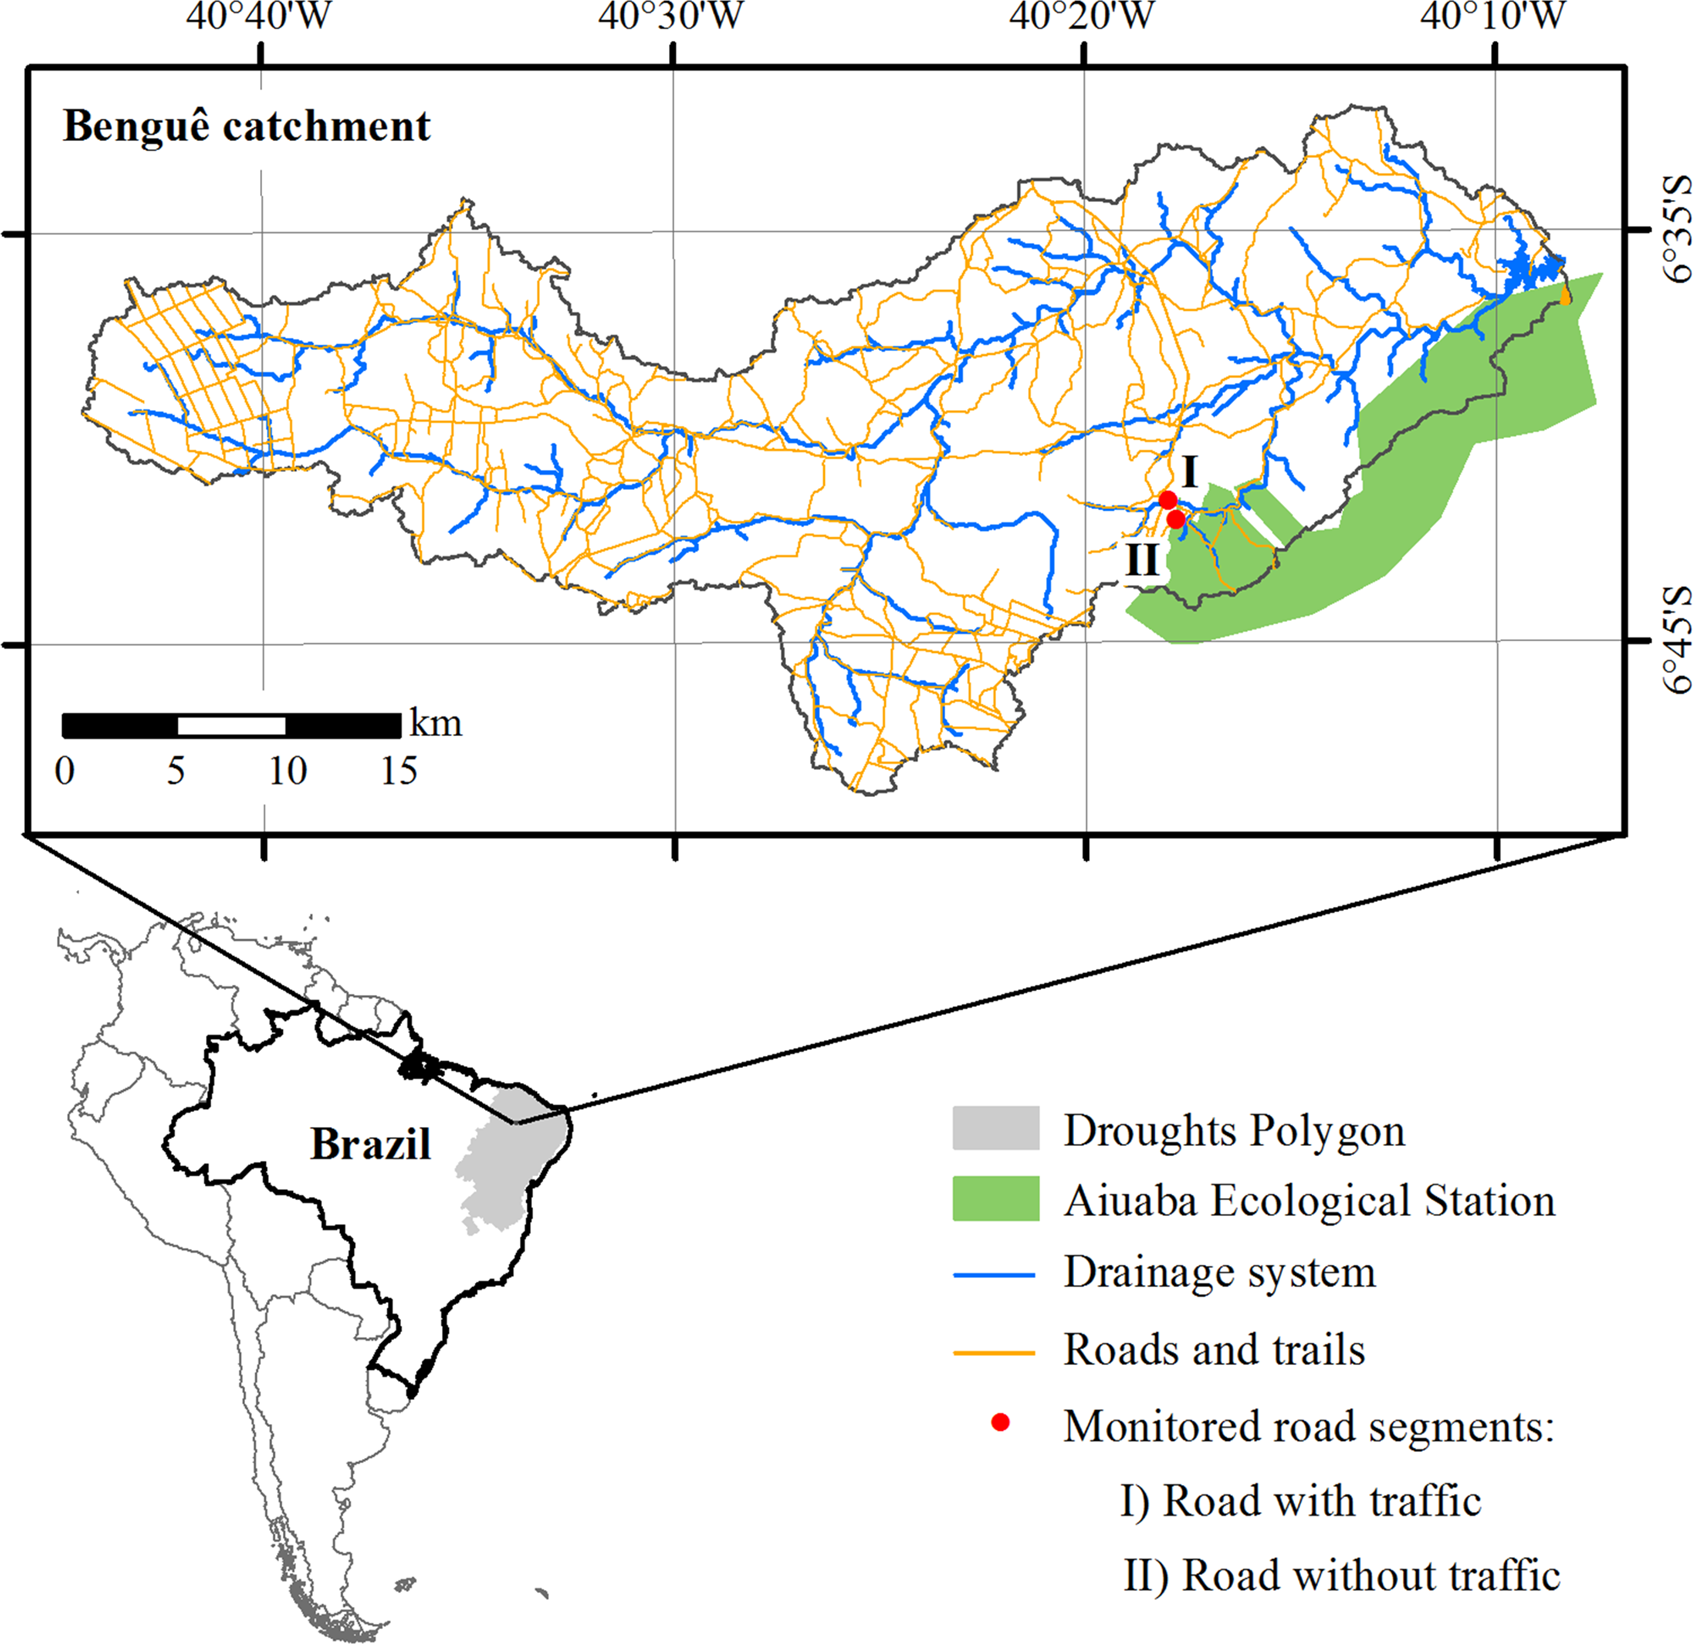
High rates of erosion and runoff production on road infrastructure have been documented, indicating that unpaved roads might be significant sources of sediment in catchments. In this paper, the production of surface sediments from unpaved rural roads at different scales is assessed. The study took place in northeastern Brazil, in a semiarid area of the Caatinga biome, vulnerable to desertification. Sediment production data from road surface segments were monitored for two years (2013-2014) under conditions of natural precipitation. By using hydrosedimentological modeling and Geographic Information System (GIS), the sediment budget was calculated at the meso-scale basin (aprox. 930 km²), in order to identify the relative contribution of roads to the sediment balance. Universal Soil Loss Equation (USLE) associated with Maner’s sediment delivery ratio (SDR) equation, proved to be an adequate approach for predicting sediment yield on the road segment scale; the best results were obtained for the road without traffic, due to the non-interference in this segment of external factors, such as traffic and maintenance activities, not explicitly considered in the model formulation. The modeling procedure showed that the roads, which occupy only 0.7% of the catchment surface, were responsible for approximately 7% of soil loss in the area. Furthermore, sediment connectivity might be enhanced by roads, which cross the river network and, therefore, deliver more directly the sediment generated at hillslopes. This is particularly important in the studied environment, where sediment connectivity is low due to limited runoff and the existence of a dense network of surface water reservoir
Evapotranspiration (ET) plays an important role in integrated water resource planning, development and management. This process is particularly relevant in semiarid regions. The aim of the present study is to compare the actual spatial and temporal evapotranspiration (ETa) patterns and temporal trends in two semiarid forests, one in Brazil (Aiuaba) and the other in Spain (Valladolid). We used the Surface Energy Balance Algorithm for Land (SEBAL) to assess the effect of climatic variation in both areas. In the Brazilian semiarid forest, Caatinga is the main vegetation, while it is stone pine in Spain. For this purpose, 69 Landsat-5 and 42 Landsat-8 images (1995 – 2019) were used. The Mann-Kendall test was applied to assess the occurrence of trends in precipitation, temperature and potential evapotranspiration data; and the Temporal Stability Index (TSI) to know which areas have greater seasonal ETa. The annual amplitude of the potential evapotranspiration (ET0) is the same in both areas, however, the Caatinga values are higher. In the Caatinga forest, when ET0 presents its highest values throughout the year, ETa presents the lowest, and vice versa. In the Pinares forest, ETa follows the ET0 dynamics during the year, and the difference between ET0 and ETa is maximum during the summer. The Caatinga forest showed a greater spatial variation of ETa than the Pinares forest as well as a greater extension with lower temporal stability of ETa than the Pinares forest. Both the Caatinga forest and the Pinares forest showed significant annual trends of increase for ET0 and ETa: 3.5 mm and 2.2 mm, and 7.0 mm and 3.9 mm, respectively.