Adrian Heald

and 12 more

Introduction Some levothyroxine unresponsive individuals with hypothyroidism are prescribed a Natural Desiccated Thyroid (NDT) preparation such as Armour Thyroid® or ERFA Thyroid®. These contain a mixture of levothyroxine and liothyronine in a fixed ratio. We evaluated the response to NDT in individuals at a single endocrine centre in terms of how the change from levothyroxine to NDT impacted on their lives in relation to quality of life (QOL) and thyroid symptoms. Methods The ThyPRO39 (thyroid symptomatology) and EQ-5D-5L-related QoL)/EQ5D5L (generic QOL) questionnaires were administered to 31 consecutive patients who had been initiated on NDT, before initiating treatment/6 months later. Results There were 28women/3men. The dose range of NDT was 60mg-180mg daily. Age range was 26-77 years with length of time since diagnosis with hypothyroidism ranging from 2-40 years. One person discontinued the NDT because of lack of response; 2 because of cardiac symptoms. EQ-5D-5L utility increased from a mean (SD) of 0.214 (0.338) at baseline, to 0.606 (0.248) after 6 months; corresponding to a difference of 0.392 (95% CI 0.241-0.542), t=6.82, p<0.001. EQ-VAS scores increased from 33.4 (17.2) to 71.1 (17.5), a difference of 37.7 (95%CI 25.2-50.2), t=-4.9, p<0.001. ThyPRO scores showed consistent fall across all domains with the composite QoL-impact Score improving from 68.3 (95%CI 60.9-75.7) to 25.2 (95%CI 18.7-31.7), a difference of 43.1 (95%CI 33. -53.2) (t=5.6, p<0.001). Conclusion Significant symptomatic benefit and improvement in QOL was experienced by people with a history of levothyroxine unresponsive hypothyroidism, suggesting the need for further evaluation of NDT in this context.

Adrian Heald

and 13 more

Introduction Type 2 diabetes mellitus (T2DM) frequently associates with increasing multi-morbidity/treatment complexity. Some headway has been made to identify genetic and non-genetic risk factors for T2DM. However longitudinal clinical histories of individuals both before and after diagnosis of T2DM are likely to provide additional insight into both diabetes aetiology/further complex trajectory of multi-morbidity. Methods This study utilised diabetes patients/controls enrolled in the DARE (Diabetes Alliance for Research in England) study where pre- and post-T2DM diagnosis longitudinal data was available for trajectory analysis. Longitudinal data of 281 individuals (T2DM n=237 vs matched non-T2DM controls n=44) were extracted, checked for errors and logical inconsistencies and then subjected to Trajectory Analysis over a period of up to 70 years based on calculations of the proportions of most prominent clinical conditions for each year. Results For individuals who eventually had a diagnosis of T2DM made, a number of clinical phenotypes were seen to increase consistently in the years leading up to diagnosis of T2DM. Of these documented phenotypes, the most striking were diagnosed hypertension (more than in the control group) and asthma. This trajectory over time was much less dramatic in the matched control group. Immediately prior to T2DM diagnosis a greater indication of ischaemic heart disease proportions was observed. Post-T2DM diagnosis, the proportions of T2DM patients exhibiting hypertension and infection continued to climb rapidly before plateauing. Ischaemic heart disease continued to increase in this group as well as retinopathy, impaired renal function and heart failure. Conclusion These observations provide an intriguing and novel insight into the onset and natural progression of T2DM. They suggest an early phase of potentially-related disease activity well before any clinical diagnosis of diabetes is made. Further studies on a larger cohort of DARE patients are underway to explore the utility of establishing predictive risk scores.

Adrian Heald

and 8 more

Introduction The COVID-19 vaccination programme is under way. Anecdotal evidence is increasing that some people with Type 1 Diabetes Mellitus (T1DM) experience temporary instability of blood glucose (BG) levels post-vaccination which normally settles within 2-3 days. We report an analysis of BG profiles of 20 individuals before and after vaccination. Methods We examined the BG profile of 20 consecutive adults (18 years of age or more) with T1DM using the FreeStyle® Libre flash glucose monitor in the period immediately before and after COVID-19 vaccination. The primary outcome measure was percentage(%) BG readings in the designated target range 3.9-10mmmol/L as reported on the LibreView portal for 7 days prior to the vaccination (week -1) and the 7 days after the vaccination (week +1). Results There was a significant decrease in the %BG on target following the COVID-vaccination for the 7 days following vaccination (mean 45.2% ±se 4.2%) vs pre-COVID-19 vaccination (mean 52.6% ±se 4.5%). This was mirrored by an increase in the proportion of readings in other BG categories 10.1-13.9%/ ≥14%. There was no significant change in BG variability in the 7days post COVID-19 vaccination. This change in BG proportion on target in the week following vaccination was most pronounced for people taking Metformin/Dapagliflozin+basal bolus insulin (-23%) vs no oral hypoglycaemic agents (-4%), and median age <53 vs ≥53 years (greater reduction in %BG in target for older individuals (-18% vs -9%)). Conclusion In T1DM, we have shown that COVID-19 vaccination can cause temporary perturbation of BG, with this effect more pronounced in patients talking oral hypoglycaemic medication plus insulin, and in older individuals. This may have consequences for patients with T2DM who are currently not supported by flash glucose monitoring.

Mike Stedman

and 5 more

Introduction: The approach to thyroid hormone replacement varies across centres but the extent and determinants of variation is unclear. We evaluated geographical variation in levothyroxine (LT4) and liothyronine (LT3) prescribing across General Practices in England and analysed the relationship of prescribing patterns to clinical and socioeconomic factors. Methods: Data was downloaded from the NHS monthly General Practice Prescribing Data in England for the period 2011-2020. Results Overall, 0.5% of levothyroxine treated patients continue to receive liothyronine. All Clinical Commission Groups (CCGs) in England continue to have at least one liothyronine prescribing practice and 48.5% of English general practices prescribed liothyronine in 2019-20. Factors strongly influencing more levothyroxine prescribing (model accounted for 62% of variance) were the CCG to which the practice belonged and the proportion of people with diabetes registered on the practice list plus antidepressant prescribing, with socioeconomic disadvantage associated with less levothyroxine prescribing. For liothyronine prescribing (model accounted for 17% of variance), factors that were associated with increased levels of liothyronine prescribing were antidepressant prescribing and % of type 2 diabetes mellitus individuals achieving HbA1c control of 58mmol/mol or less. Factors that were associated with reduced levels of liothyronine prescribing included smoking and higher obesity rates. Conclusion: In spite of strenuous attempts to limit prescribing of liothyronine in general practice a significant number of patients continue to receive this therapy, although there is significant geographical variation in the prescribing of this as for levothyroxine, with specific general practice and CCG related factors influencing prescribing of both levothyroxine and liothyronine.

David Miles

and 2 more

Vaccination against the COVID-19 virus began in December 2020 in the UK and is now running at 5% population/week. High Levels of social restrictions were implemented for the third time in January 2021 to control the second wave and resulting increases in hospitalisations and deaths. Easing those restrictions must balance multiple challenging priorities, weighing the risk of more deaths and hospitalisations against damage done to mental health, incomes and standards of living, education outcomes and provision of non-Covid-19 healthcare. Weekly and monthly officially published values in 2020/21 were used to estimate the impact of seasonality and social restrictions on the spread of COVID-19 by age group, on the economy and healthcare services. These factors were combined with the estimated impact of vaccinations and immunity from past infections into a model that retrospectively reflected the actual numbers of reported deaths closely both in 2020 and early 2021. It was applied prospectively to the next 6 months to evaluate the impact of different speeds of easing social restrictions. The results show vaccinations are significantly reducing the number of hospitalisations and deaths. The central estimate is that relative to a rapid easing, the avoided loss of 57,000 life years from a strategy of relatively slow easing over the next 4 months comes at a cost in terms of GDP reduction of around £0.4 million/life-year loss avoided. This is over 10 times higher than the usual limit the NHS uses for spending against Quality Adjusted Life Years (QALYs) saved. Alternative assumptions for key factors affecting give significantly different trade-offs between costs and benefits of different speeds of easing. Disruption of non-Covid-19 Healthcare provision also increases in times of higher levels of social restrictions. In most cases, the results favour a somewhat faster easing of restrictions in England than current policy implies.

Adrian Heald

and 4 more

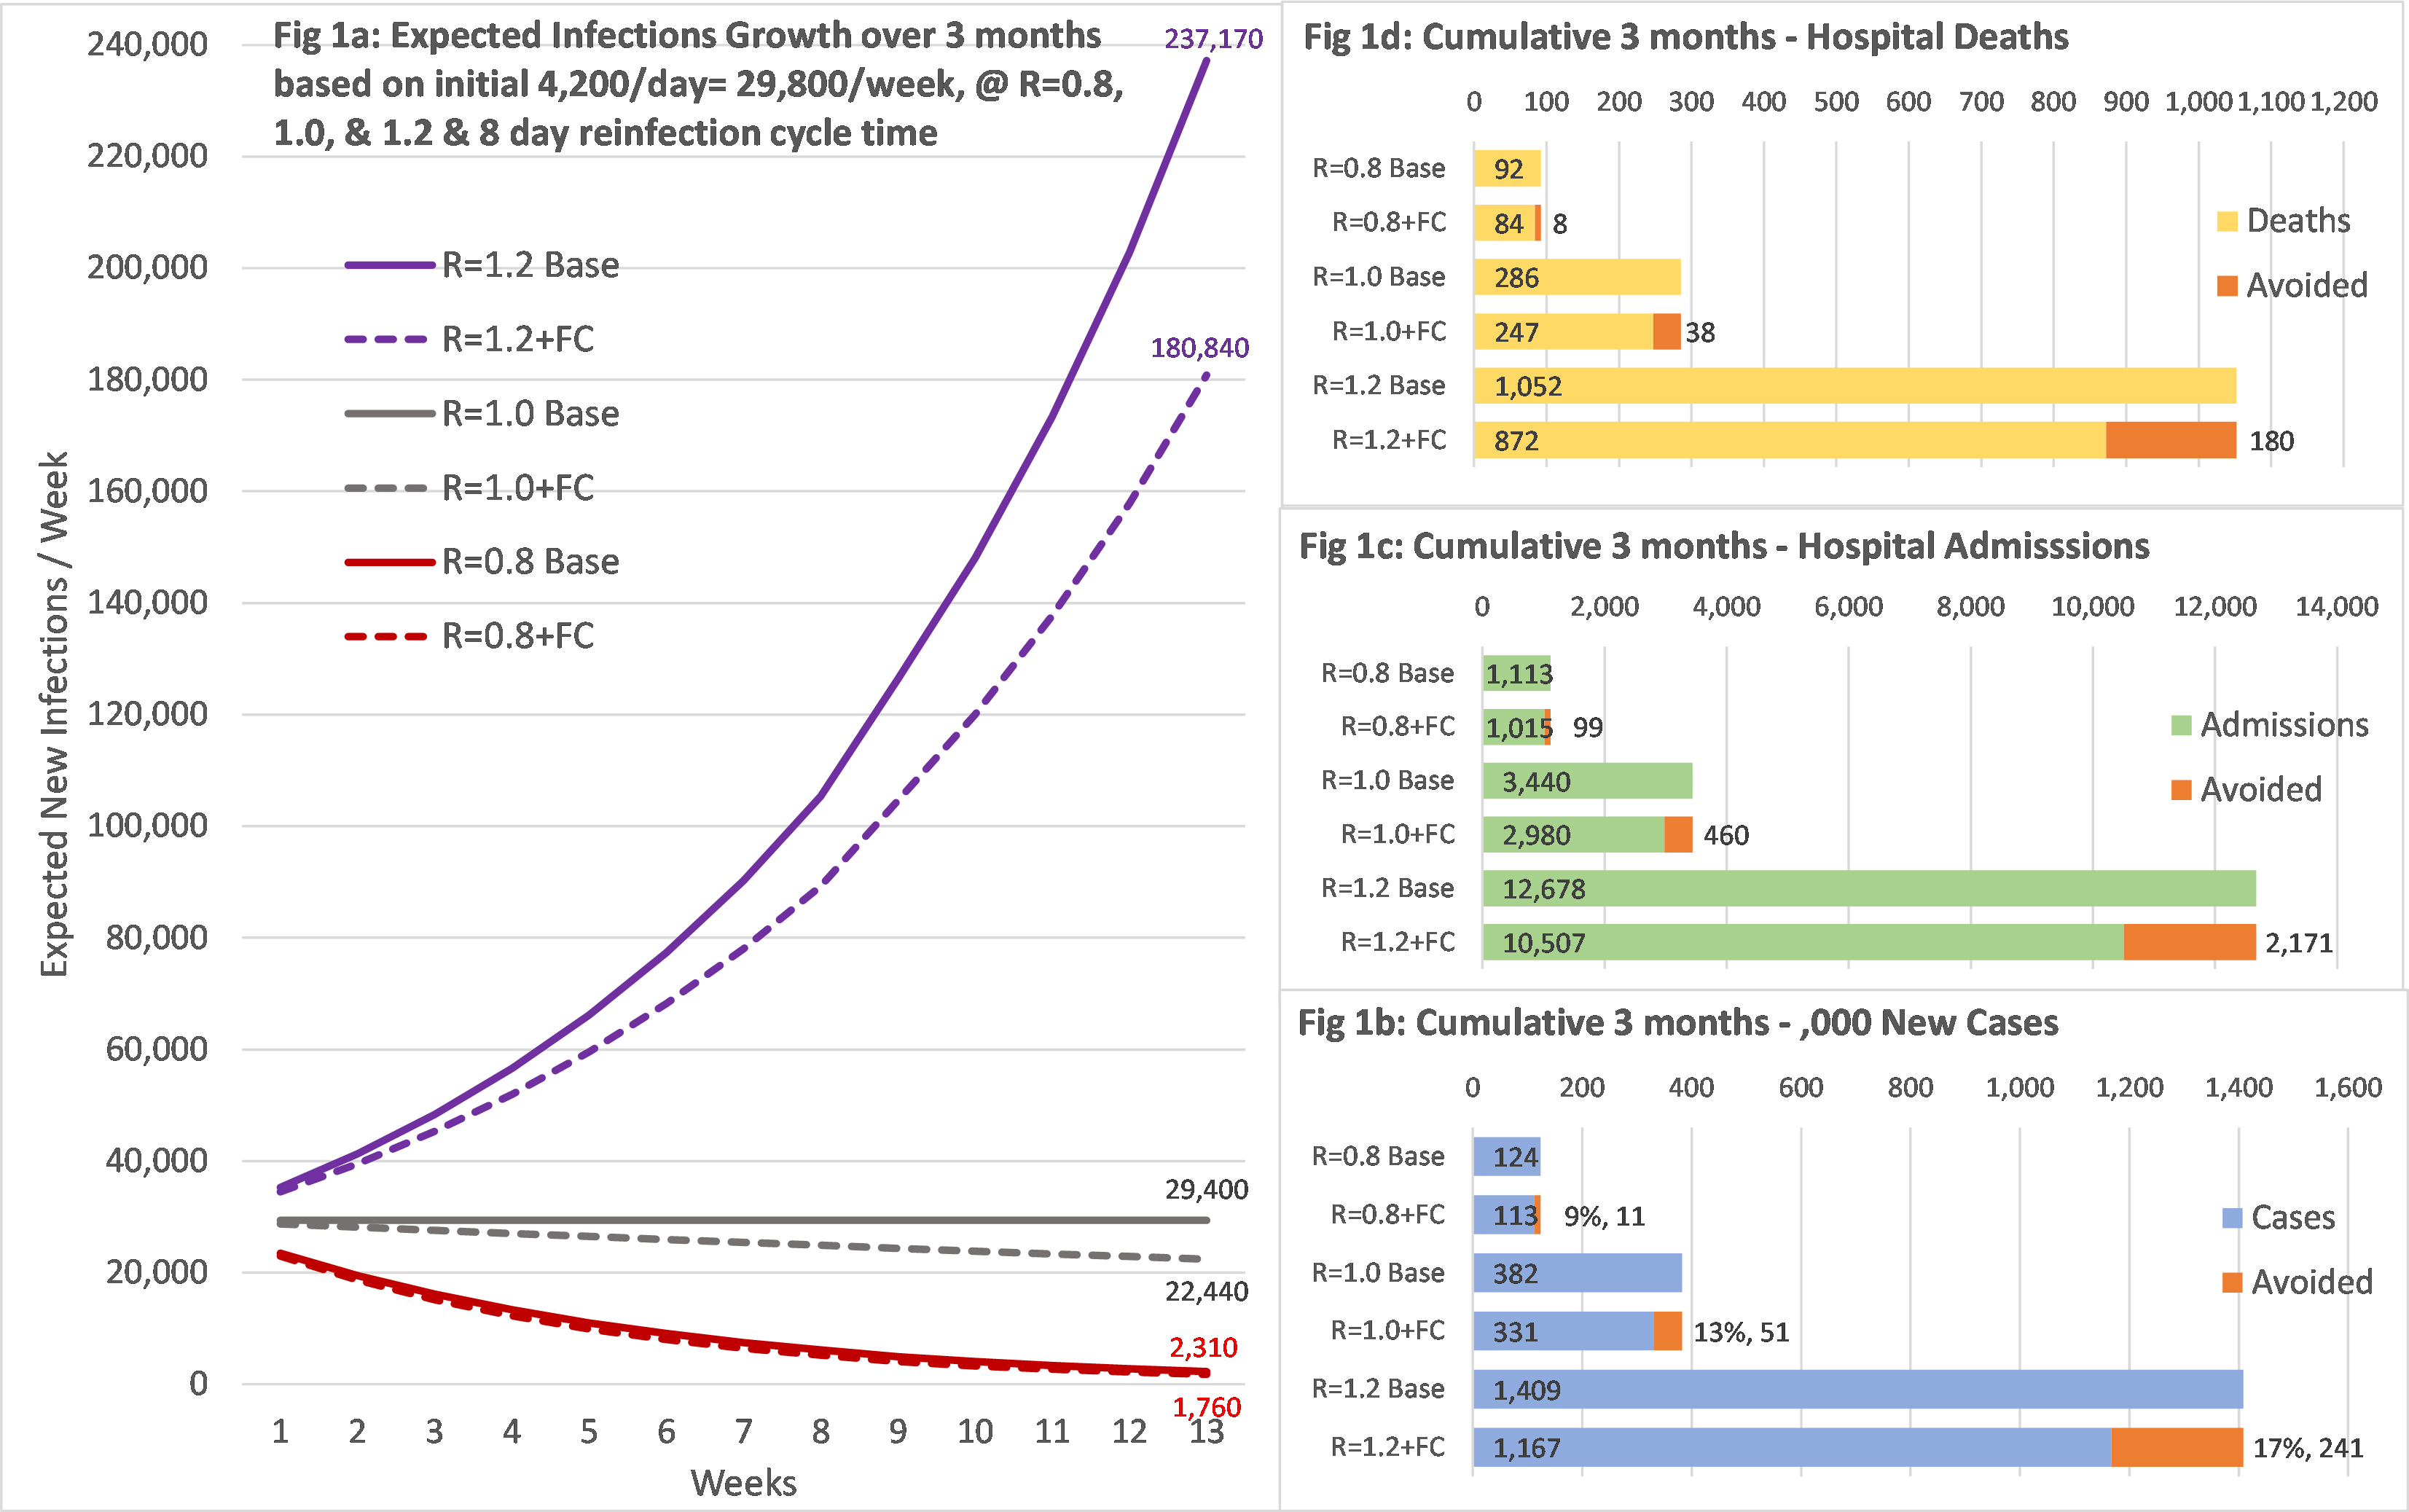
Introduction The rapid spread of the pandemic caused by the severe acute respiratory syndrome coronavirus 2(SARS-CoV-2)(COVID-19) virus resulted in governments around the world instigating a range of measures, including mandating the wearing of face coverings on public transport/in retail outlets. Methods We developed a sequential assessment of risk reduction provided by face coverings using a step-by-step approach. The United Kingdom Office of National Statistics(ONS) Population Survey data was utilised to determine the baseline total number of community-derived infections. These were linked to reported hospital admissions/hospital deaths to create case admission risk ratio/admission-related fatality rate. Results Overall, we show that only 7.3% of all community-based infection risk associates with public transport/retail outlets. The reported weekly community infection rate was 29,400 new cases at the start (24th July). The rate of growth in hospital admissions and deaths for England was around -15%/week, suggesting the infection rate, R, in the most vulnerable populations was just above 0.8. In this situation, average infections over the evaluated 13week follow-up period was 9,517/week. With face covering of 40% effectiveness, this reduced average infections by 844/week, hospital admissions by 8/week and deaths by 0.6/week; a fall of 9% over the period total. If, however, the R-value rises to 1.0, then average community infections would stay at 29,400/week and face coverings could reduce average weekly infections by 3,930, hospital admissions by 36 and deaths by 2.9/week; a 13% reduction. These reductions should be seen in the context of 102,000/week all-cause hospital emergency admissions in England and 8,900 reported deaths in the week ending 7thAugust 2020. Conclusion We have illustrated that the policy on mandation of face coverings in retail outlets/on public transport may have limited value in reducing hospital admissions/deaths. Impact appears small compared to all other sources of risk, thereby raising questions regarding effectiveness of the policy.

David Miles

and 2 more

The COVID-19 pandemic has transformed lives across the world. In the UK there has been a public health driven policy of population ‘lockdown’ that had enormous personal and economic impact. We compare UK response/outcomes including excess deaths with European countries with similar levels of income/healthcare resources. We calibrate estimates of the economic costs as different %loss in GDP against possible benefits of avoiding life years lost, for different scenarios where local COVID-19 mortality/comorbidity rates were used to calculate the loss in life expectancy. We apply quality-adjusted life years (QALY) value of £30,000 (maximum under NICE guidelines). The implications for future lockdown easing policy in the UK are also evaluated. The spread of cases across European countries was extremely rapid. There was significant variation both in severity and timing of both implementation and subsequent reductions in social restrictions. There was less variation in the trajectory of mortality rates and excess deaths, which have fallen across all countries during May/June 2020. The average age at death and life expectancy loss for non-COVID-19 was 79.1 and 11.4years respectively while COVID-19 were 80.4 and 10.1years; including for life-shortening comorbidities and quality of life reduced this to 5QALY for each COVID-19 death. The lowest estimate for lockdown costs incurred was 50% higher than highest benefits from avoiding the worst mortality case scenario at full life expectancy tariff and in more realistic estimation they were over 50 times higher. Application to potential future scenarios showed in the best case a QALY value of £220k (7xNICE guideline) and in the worst-case £3.7m (125xNICE guideline) was needed to justify the continuation of the lockdown. The evidence suggests that the costs of continuing severe restrictions in the UK are so great relative to likely benefits in numbers of lives saved so that a substantial easing in restrictions is now warranted.