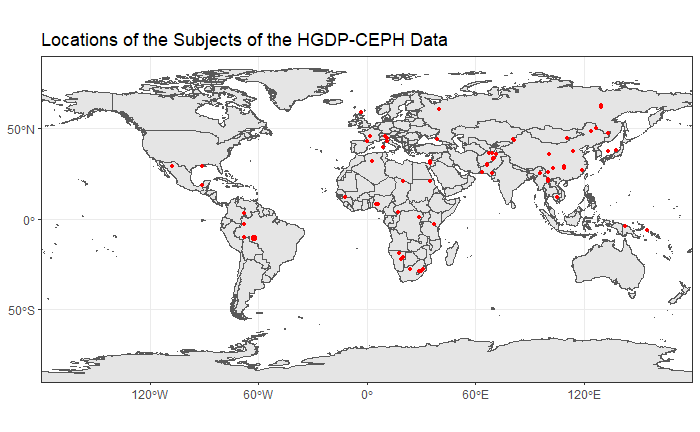
ABSTRACT DNA sequencing of the human genome significantly contributes to the investigation of the genomic patterns in population structure. However, genomic data is massively high dimensional and requires proper computational tools and statistical analysis methods to study it. In this paper, principal component analysis (PCA), a dimensionality reduction method, was applied to the Human Genome Diversity Panel (HGDP-CEPH) data to understand the population structure. The HGDP-CEPH data contains 660K SNPs of 1043 individuals from seven major population groups and 52 populations. We explored the structure of the population groups using both individual chromosomal as well as whole genome data. We also investigated populations within population groups. In addition, PCA was compared to two other dimensionality reduction methods: t-distributed stochastic neighbour embedding (t-SNE) and multi-dimensional scaling (MDS). Our findings show that PCA delivered several interesting insights into the structure of human populations, and is still an effective tool for extracting value from high dimensional DNA sequence data. INTRODUCTIONNext-generation sequencing technologies are significantly contributing to the study of the structure and organization of the human genome. Since such technologies can detect millions of genomic variants among fully sequenced population samples, they provide a path to discovering the population structure and inferring the demographic history of the natural populations \cite{Bamshad2004}. Previous studies show that 93%-95% of the human genetic variations is attributable to within population differences among individuals and 3%-5% is due to population differences \cite{Rosenberg_2002}. However, there are many computational challenges associated with next-generation sequencing, such as the production of high dimensional and complex data. High dimensional data, as is found in genomic data, is a major challenge in data science. Currently, without highly advanced methods, genomic data is still subject to the curse of dimensionality. To overcome this problem, several dimensionality reduction algorithms appeared, one of which is principal component analysis (PCA) \cite{Siu_2012}. Principal component analysis is an unsupervised learning method that aims to produce a low dimensional representation of high dimensional data while capturing as much of the information as possible. The method uses the original variables to find a sequence of linear combinations, producing a new set of variables. The new variables, called principal components (PCs), maximize the variance and are mutually uncorrelated. To clarify, the first principal component has the highest variance, is the most informative, and is uncorrelated with all the other principal components. Principal component analysis can be applied to genomic data to understand the population structure. Single nucleotide polymorphisms, or SNPs, are parts in the DNA that cause genetic variation among individuals. Therefore, using PCA to work with SNP data unfolds the genomic differences among populations and clusters them accordingly. This could potentially allow researchers to link diseases with specific genes and understand the history of evolutionary forces \cite{Barbujani_2010}. The major contributions of this work can be summarized as follows: 1- PCA is able to make observations about the seven main population groups available in the HGDP-CEPH data.2- Applying PCA on the chromosome level shows that there are no major visual differences between chromosomes in clustering populations, and that a single chromosome is sufficient to draw conclusions related to population structure.3- PCA was used to reveal within population group structure and relationships between populations belonging to different population groups.4- Other dimensionality reduction methods, being Multi-dimensional Scaling (MDS) and t-Distributed Stochastic Neighbour Embedding (t-SNE), were tested to investigate their ability to explore the population structure, and to compare them with PCA. The goal of this paper is to visualize and make observations about the data using PCA, and to test PCA's effectiveness to explore the population structure. The paper is organized as follows: a detailed description about the data and the statistical problem is discussed in section 2. A brief explanation about the theory behind the statistical methods used and the procedure of splitting the data in section 3. Results are presented in section 4. Final discussion and closing remarks are presented in section 5.2. DETAILED DESCRIPTION OF PROBLEM2.1 Data The dataset used for the analysis of this paper is from the Human Genome Diversity Project (HGDP-CEPH) which can be found on http://www.cephb.fr/hgdp/ . The dataset contains 660,918 SNPs for the 22 chromosomes of 1043 subjects. The subjects come from 52 populations of 7 major population groups: Africa, America, Central and South Asia, East Asia, Europe, Middle East and North Africa (MENA), and Oceania. The location map of the subjects' origins is visualized in Fig. \ref{591956}. The raw data was encoded as 0,1, or 2, with 0 representing the major allele and 2 representing the minor allele. For the missing values, genotypes were imputed based on the mean of a SNP. Data encoding and imputation were done using R's programming language (3.6.3) by BiocManager::snpReady::raw.data.