What is an evidence map and how does it differ from an systematic review?Evidence on the effectiveness or prevalence of a health condition or an environmental exposure and health outcome can be presented in many different ways. In those situations where primary studies are available, it is possible to conduct evidence synthesis using the primary studies based on systematic reviews and  meta-analyses.  In systematic reviews, such syntheses follow the steps of framing an answerable question using the population under consideration, the specific intervention or the exposure, the comparison groups, and the specific outcomes. Beyond identifying the studies and a narrative summary of the key findings, no specific summary statistic of the findings from the primary studies is presented \cite{khan2003five}. In a meta-analysis, on the other hand, in addition to narrative summaries, findings from the primary studies are combined to produce summary estimates; besides, in a meta analysis a formal statistical examination of the biases involved in selecting only those studies that were large in size and had positive outcomes is also conducted -- this is referred to as "publication bias". Further, a meta analysis provides an opportunity to examine how the findings would differ or examination of the relationships between different entities in the analyses, referred to as sensitivity analyses or meta-regression \cite{deeks2019analysing}. In  meta-analysis and systematic review, the analyst aims to collect and process the primary sources and then critically appraise the body of the literature to identify biases in the conduct of the study or whether a cause and effect association can be justified based on the nature of the studies, and also attempts to conduct a narrative or a statistical summary of the key findings. Sometimes this is not necessarily the aim of the research, in particular when information about an exposure and an outcome is emerging on a particular topic. In those circumstances, the strategy is to identify what literature are available out there without necessarily conducting either a full critical appraisal of the body of the literature, or statistically summarising the findings. The goal in these situations is to identify the body of evidence that has accrued and the populations studied, the interventions or the exposures assessed, the comparison groups studied, and the key outcomes. In addition, analysts may also be interested to study the data sources, and other details that are not necessarily the main aims of a formal systematic review. Here, rather the aim is to "map" the "landscape" of the research. This is where an "evidence map" or "evidence gap map" is useful, as these information are useful for the analyst or the researcher to identify "what is out there" and what gaps in the available evidence exists. Hence an evidence map is  about laying the "landscape" of what evidence exists about a research question and they provide a visual overview of existing evidence. A  World Bank document on evidence gap maps states that the idea is to conduct a visual summary of the evidence. In the context of environmental health, defining evidence maps, the journal "Environmental Evidence" states, Systematic Maps are overviews of the distribution and abundance of evidence in relation to multifaceted elements of a broad question of policy or management relevance. The process and rigour of the mapping exercise is the same as for systematic review except that no evidence synthesis is attempted to seek an answer to the question. For example, suppose you are interested to find out what recent evidence exists in terms of heart disease risks of exposure to ambient air pollution in the studies published in the past one year, but you do not want to critically appraise each article or formally synthesise the literature, you can construct an evidence map about how many studies on heart health effects of air pollution were reported in the scholarly literature databases since first January of 2019 (and up to a certain date of your choice, say 31st December 2019), in order to understand the landscape of the current research and then on the basis of your findings, you could construct a visual overview of these topics. These might include for example, how many studies were published on the relationship between ambient air quality and exposure to particulate pollution and people suffering from heart attacks (acute myocardial infarction), how many studies investigated the association between long term exposure to air pollution and ischaemic heart disease.  You would then construct the maps of these various considerations and would be able to obtain a snapshot of the research and policy landscape. What you would not do would be to summarise the results of these studies. That would be the objective of a scoping review rather than an evidence map \cite{munn2018systematic}.  So in summary:An evidence map is a "map" like structure It uses some principles of systematic reviewIt provides a list of articles and resourcesIt provides a visual summary in the form of tables and graphs as to what evidence are available on a particular topicThere is no data analysis or narrative summary of the findings involved unlike that of a scoping reviewThere may  be some quality appraisal, but it is not the main purpose of an evidence map unlike that of systematic review or meta-analysis. In this tutorial, I'd like to present the steps of a rapid evidence map construction. For full details and more detailed work, please review the list of citations and references I have included at the end of this document. Here, we will aim to construct a rapid and "miniaturised" evidence map on an environmental topic. Using the skills of searching literature and some data analyses such as using a spreadsheet or an open source statistical tool such as R or Python, you can construct a visual or knowledge map or evidence map. Steps of constructing an evidence mapStep 1: Frame a PECO or PICO (population, exposure or intervention, comparison group, outcomes) formatted questionThis is the first step.  Develop a question based on the four criteria:P: represents population or people. Who are the human beings or which population will benefit from this question? For example, if you are interested in learning about what evidence exists that exposure to air pollution is associated with increased heart disease risks among elderly, then the population should reflect elderly (those above 65 years old). You can further narrow down the population to mean certain ethnicity (Whites or Maori in New Zealand), or only men or only women, or restrict the age band to above 65 years and below 85 years to exclude the old olds, or those who live in cities and towns and not in villages and so on. E or I: If you are studying the effects of interventions, then the preferred entity would be interventions, otherwise E. Suppose you want to study the effectiveness of improved stoves on respiratory illnesses as improved stoves are known to reduce indoor air pollution  \cite{smith2007monitoring}. Besides, you know that indoor air pollution is a risk factor for heart disease \cite{Fatmi2016}. In that situation, you will use an "intervention". Alternatively, you can also use E or exposure, if all you are interested in studying what are the heart health risks of those who are exposed to air pollution. Comparator or comparison group or C: The comparison group will be in comparison with the exposure. So, if you are studying exposure to air pollution and heart disease among elderly people, then your comparison group will be elderly people who are either NOT exposed to air pollution at all, or if that is not possible to lesser extent of air pollution (this is  perhaps more realistic). If you are studying effectiveness of improved stoves as intervention and reduced heart disease risk in the elderly, then improved stoves is the intervention whose effect you want to study. Your comparison group will be those who do not use improved stoves in the household. O is for outcomesAfter you have defined P, E or I, and C, define the outcomes that you want to study. For example, in our case we want to study what evidence exists in the literature since 2019 about the excess heart disease risk among people who are exposed to air pollution? Outcome for us can be defined in terms of heart disease risk or death from heart disease. This might include acute myocardial infarction (also abbreviated as AMI, or known as heart attack or stroke), or hospital admission with AMI. We have mentioned this as "heart disease". However, the more precise you can be in defining the outcome, the more focused will be your review.Once you have settled on the P, E or I, C, and O, it is time for you to put them together in the form of a table and a question. The question is referred to as PICO (or PECO) question. You accompany this question by developing a table (Table \ref{794788}). To give you an example, we have put together a question and a table for our evidence map of all studies on air pollution and heart disease published since 2019. Here is the PICO formatted question"Compared with those with lower levels of exposure to air pollutants, those who are exposed to higher levels of air pollution, what is the risk of heart disease among older adults?"Here is the accompanying table:
In this paper, we introduce the concepts of critically reading research papers and writing of research proposals and reports. Research methods is a general term that includes the processes of observation of the world around the researcher, linking background knowledge with foreground questions, drafting a plan of collection of data and framing theories and hypotheses, testing the hypotheses, and finally, drafting or writing the research to evoke new knowledge. These processes vary with the themes and disciplines that the researcher engages in; nevertheless, common motifs can be found. In this paper, we propose three methods are interlinked: a deductive reasoning process where the structure of the thought can be captured critically; an inductive reasoning method where the researcher can appraise and generate generalisable ideas from observations of the world; and finally, abductive reasoning method where the world can be explained or the phenomena observed can be explained or be accounted for. This step or reasoning is also about framing theories, testing and challenging established knowledge or finding best theories and how theories best fit the observations. We start with a discussion of the different types of statements that one can come across in any scholarly literature or even in lay or semi-serious literature, appraise them, and identify arguments from non-arguments, and explanations from non-explanations. Then we outline three strategies to appraise and identify reasonings in explanations and arguments. We end with a discussion on how to draft a research proposal and a reading/archiving strategy of research.
Reproducible research in public health with Jupyter notebooks Reproducible and replicable research refer to a process of research where researchers share transparent and reliable work processes online or through other means so that their work can be both repeated and replicated by others. As epidemiologic research is increasingly focussed on identifying risk factors that are small in magnitude and therefore has many confounding variables that need to be adjusted for, and as increasing amount of data are now made available in the public domain for independent researchers and analysts to verify and test the validity of earlier research, Peng and Zeger (2006) suggest that for public health, reproducibility should be a minimum criterion . They write: The reproducibility of epidemiologic findings from current and future studies will be crucial to providing the substance for informed debate regarding policies affecting the public's health Using Schwab et.al. (2000) recommendations of reproducibility of research in the context of computer science, they suggest the following for public health interventions: --------------------------------- Component Requirement --------------- ----------------- Data Available Methods Data set (raw and analytical), computer code, and steps are made available to enable execution Documentation the documentation of the data set, and the codes will enable replication Distribution The codes, software, and the documentation must be made available to others --------------------------------- . While raw data can be complex and for researchers, it'd be necessary only to work on a subset of the raw data to enable replication of the results. Hence Peng and Zeger suggest that at the least, the analytical data set should be made available to the other researchers. In their study on the extent to which observational epidemiological studies were also reproducible, Peng and Zeger conducted an analysis of the published literature of observational epidemiological studies and found that in their selection of 90 studies published in 2005, none (0/90) had codes for statistical procedures were made available; further, 43/69 (62.3%) did not report the methods used for processing the data they used for analysis. They found that 93% of the articles did not report how the measured data were processed, and therefore one could not replicate the results with new data. The rise of literate programming & the need for free, open source software in reproducible research In a data-driven discipline such as Epidemiology, the way to practice reproducible research depends on how well the analysts share data and the steps involved in accessing the raw and processed data and also the details of how the methods were conducted to preprocess the data as well as analysed data, and the models and how the models were conducted. This needs three inter-related issues to be resolved: first, we need an approach where data and code are best woven together and the stories that result from this interleave are then disseminated to the wider scientific community to test and verify. We need this to make things simple so that other researchers can keep the issue of data analysis in context; we need software to be freely and openly accessible for examination: we need this so that the underlying assumptions in the analytics can be tested. Freedom here suggests not only that the user of our information do not pay for the services ('free as in free beer') but also, the freedom to study and modify the code where needed . Donald Knuth (1984) coinded the term 'literate programming' to indicate a style of computer code writing where software documentation and the procedures and codes were written together . By combining codes and context, meaning, and annotation of the written code to solve a particular problem or address an analytical task, the authors provide both a context and help others to replicate the findings within a meaningful context. Layered on this is the question of whether such processes are available for everyone freely and openly. Here, web provides a level playing ground where others can use the power of a web based solution to replicate these findings using distiributed resource. Perez and Granger (2015) call this combination of data, code, and narrative as "computational narrative"; an app, Jupyter provides an instantiation of how this can be achieved where it is possible to write code and narrative not only in plain text but also weave in codes and text and produce the output in the format of a text document . Jupyter notebooks are digital notebooks that can be used to weave codes, and literate programming in python, julia, and R, and can be used to distribute codes and text . The world wide web has played an important role in the creation and distribution of knowledge. Collaborative resarch writing can be conducted using Google docs, or Overleaf, and Authorea. In each case, it is possible to bring in diverse groups of authors to collaborate on the same platform to write a paper. Using jupyter notebooks and hosting them in github and then in binder, it is also possible to set up a web based system where one can analyse and write a paper on the same platform. Converting a jupyter notebook to a standard article format that can be presented on a journal is possible through first converting the notebook to a markdown format and then converting the markdown format to a journal article format. Jupyter notebooks provide the mechanism to convert a notebook to a markdown format and the software pandoc provides the tools to convert a markdown document with an associated bibtex file to be converted to a journal article format that can then be put out either in the form of a pdf document, or a word document that most journals would accept for publishing. The original data set and the jupyter notebook can be shared using github with the rest of the world. Preprint servers offer opportunities to host papers before printable format for publishing to draw in comments from the community. In this way, it is possible to harness digital tools that will allow one to collect data, clean, and analyse data, and share the process of the data analysis and insights rapidly with a group of people. Method Here, we provide an instance of a workflow using jupyter notebook, github, and Authorea to analyse a data set and write a paper based on the data set as a demonstration of what can be done in a setting such as this. can live in the github repo and the text of a paper can live in Authorea where this can be pushed to Authorea through the jupyter notebook and a bibtex file can be built and worked around. The following steps will connect to be done: 1. First, set up an Authorea file using Authorea 2. Next, connect the Authorea article to github 3. Now clone the git repo on your local computer 4. Assuming that you have Jupyter installed, you can start a jupyter notebook in the same folder 5. Work on the jupyter notebook for the analyses 6. Convert the notebook to markdown but with the following features: for tables, you can either use markdown tables or convert the data tables to csv files, and save the graphs separately as png files 7. Now convert the ipynb file into markdown file 8. Modify the layout.md file & add the name of the jupyter notebook markdownified file there 9. Now add, commit, and push the files to github Once in Authorea, do as follows: 1. Upload the tables as csv files 2. Upload the images 3. From directly within the editor of Authorea, adjust the citations to meet the standards of the journal 4. The text can either be edited from within Authorea or within Jupyter and pushed to Authorea as markdown files 5. Markdown tables are left as is. Sharable jupyter notebooks can also be shared by Binder.org and the article distributed using Authorea or PeerJ or F1000. The data can be stored in figshare, or in github itself. Results: an exploratory data analysis using this method The results of this process is a description of the flow of work we have conducted in the process. We have already created an article in Authorea We have implemented the workflow we described in the above steps in the steps where we integrate literate programming below. We will read the data set, then we will conduct preprocessing of the data, and we will save the resulting tables in the folder and we will use them in the final processing in Authorea. We will also use Authorea to store the data in the form of csv file, and the analyses in the form of ipynb file for sharing. Additionally, we will share the data through figshare and the notebook through binder for anyone to reproduce and work on the findings. ## Load the packages as needed library(tidyverse) library(knitr) library(DiagrammeR) ## these three libaries are needed for constructing diagrams, conducting research in a particular # way, etc ## read the data mydata <- read_csv("WHO.csv", na = "") # to find out the variables loaded with the data set, #names(mydata) # to find out the structure of the data set # str(mydata) # 202 observations of 358 variables # Let's create a short version of the data set with first 12 variables mydatar <- mydata[, c(1:12)] # structure of mydatar? #str(mydatar) # 202 observations of 12 variables # variable names ## rename the variables mydatar1 <- mydatar %>% rename(afr = `Adolescent fertility rate (%)`) %>% rename(alr = `Adult literacy rate (%)`) %>% rename(gni_percap = `Gross national income per capita (PPP international $)`) %>% rename(psenrol_f = `Net primary school enrolment ratio female (%)`) %>% rename(psenrol_m = `Net primary school enrolment ratio male (%)`) %>% rename(totpop = `Population (in thousands) total` ) %>% rename(urbanpop = `Population in urban areas (%)`) %>% rename(pop_agr = `Population annual growth rate (%)`) %>% rename(pop_below_pov = `Population living below the poverty line (% living on &lt; US$1 per day)`) ## Let's summarise the information by continent sum_mydata <- mydatar1 %>% group_by(Continent) %>% summarize(mean_afr = mean(afr, na.rm = T), mean_alr = mean(alr, na.rm = T), mean_gnipercap = mean(gni_percap, na.rm = T), mean_psenrol_f = mean(psenrol_f, na.rm = T), mean_pbp = mean(pop_below_pov, na.rm = T)) ## this has returned a data set with these five variables ## the summarised data can be presented in the form of a table kable(sum_mydata)
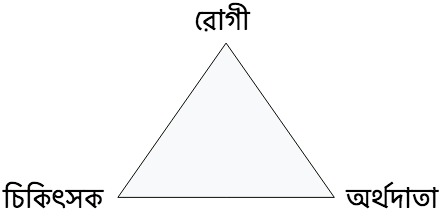
কাকে বলে রোগী কেন্দ্রিক চিকিৎসা? একটি চিকিৎসার কাহিনিএকটি অভিজ্ঞতার গল্প শুনুন। মাস দুয়েক আগের কথা। বাড়িতে শীর্ষাসন করতে গিয়ে মনে হয় ঘাড়ে আঘাত পেয়েছিলাম। প্রথম দু-একদিন ঘাড়ে অল্প ব্যথা করছিল । তারপর একদিন মাঝরাতে পিঠের যন্ত্রণায় ঘুম ভেঙে গেল। পিঠের ডান দিকে যন্ত্রণা হচ্ছিল, ডানহাতের বুড়ো আঙুলে সাড় ছিল না, হাত দুর্বল; তখন মনে হল কাঁধে গরম জলের ব্যাগ দিয়ে রাখি, তাহলে হয়ত আরাম হবে। জল ফুটিয়ে ব্যাগে যেই পুরতে গেছি, ফুটন্ত জল চলকে আমার ডান হাতে পড়ল, অমনি হাতের চামড়া ঝলসে গেল । একে সপ্তাহের শেষ, তায় অত রাতে ডাক্তার পাওয়া যাবে না, হাসপাতাল আমার বাড়ি থেকে বড় শহরে একশ কিলোমিটার দূরে, অতএব নিজের  প্রাথমিক চিকিৎসা  নিজেকেই করতে হল। কোন রকমে দুদিন গেল।  ততদিনে দেখা গেল যে হাতে বেশ বড়সড় একটা ফোসকা পড়েছে। ঝলসানো চামড়ার ও ফোসকার ড্রেসিং করাতে আমার পরিচিত একটি  ক্লিনিকে গেলাম। সেখানে  এক অপরিচিতা নার্স আমার চিকিৎসা করলেন। তিনি ড্রেসিং করার সময় থমথমে মুখে কাগজ দেখে মন দিয়ে কাজ করে গেলেন, আমার সঙ্গে একটি কথাও বললেন না। আমার কেমন যেন অস্বস্তি হচ্ছিল যে তাঁর সামনে একজন মানুষ বসে আছে, সে মাঝে মাঝে যন্ত্রণায় আর্তনাদ করে উঠছে, তাকে আমল দেওয়া দূরের কথা, যন্ত্রণা হচ্ছে কি না, একবার জিজ্ঞেসও করলেন না, খস খস করে কাঁচি দিয়ে, এমন ভাবে পোড়া চামড়া কেটে দগদগে কাটা ঘায়ের ওপর মলম আর পটি দিয়ে ড্রেসিং করলেন হাতটা যেন শরীরের বাইরের কোন একটা অংশ, তারপর নিপুণ হাতে পরিপাটি করে ব্যাণ্ডেজ বেঁধে দিলেন। দিয়ে  আমাকে মৃদু শাসনের সুরে বললেন, এই ভাল করে ড্রেসিং করে দিলাম, বাইরে বসে একটু জিরিয়ে নিয়ে বাড়ি চলে যান। দেখবেন যেন একটুও জল লাগাবেন না, সাত দিনে সেরে যাবে।চিকিৎসা শুরু হবার দশ দিনের মাথায় হাতের ঘা সেরে গেল, পটি খোলা হল। আমি সুস্থ হলাম। আমার চিকিৎসা যে চিকিৎসক, ফিজিওথেরাপিস্টরা,  নার্স-রা করেছেন তাঁরা সকলে অভিজ্ঞ ও দক্ষ, তাঁদের পেশাগত নৈপুণ্য প্রশ্নাতীত, ক্লিনিকটি  পরিষ্কার পরিচ্ছন্ন, তাতে প্রায় যত রকমের আধুনিক ব্যবস্থা থাকা প্রত্যাশিত সব ছিল। আমার দেশ, নিউজিল্যাণ্ডে, সরকার দেশের মানুষের চিকিৎসার ব্যয়ভার বহন করেন, তাই আমার চিকিৎসার মোট খরচ নামমাত্র, এবং আমি যথাসময়ে কোন রকম গোলমাল ছাড়াই পুরোপুরি ভাল হয়েও গেছি ।তথাপি সেদিনের নার্স ভদ্রমহিলার কাছে পাওয়া সেই নৈর্বক্তিক নিদান বলুন কি দাওয়াই, আমার মনে দাগ কেটে গেল । ব্যাণ্ডেজ করা হাতের ভেতরের যন্ত্রণা সহ্য যেমন করেছি, তেমনি আমি নিজেকে প্রশ্ন করেছি, এই যে চিকিৎসা পেলাম, এ চিকিৎসা প্রকৃত গুণমান কিভাবে বিবেচনা করব? এ চিকিৎসার গুণমান যদি নিরূপণ করতে হয়, রোগী হিসেবে তাতে চিকিৎসা পেতে গিয়ে আমার মনে যে অসন্তোষ দেখা দিল তাকে কি উপেক্ষা করব? কেন? চিকিৎসার মান শুধু কি শারীরিক ভাবে সুস্থ হয়ে যাওয়া দিয়ে বিচার করা হবে? বিশ্ব স্বাস্থ্য সংস্থার সংজ্ঞা অনুযায়ী স্বাস্থ্য কেবল শরীরের রোগমুক্তি নয়, মন ভাল হওয়া, সামাজিক ভাবে সুস্থ থাকা, সবকিছু নিয়ে \cite{3075921}। তাই যদি হবে, তাহলে রোগীর প্রতি চিকিৎসকের নৈর্বক্তিক আচার আচরণকে, যে আচরণে রোগী বিমর্ষ বোধ করেন, চিকিৎসার মান নির্ধারণে তাকেও বিচার করে দেখতে  হবে নিশ্চয়ই? কোন উপায়ে গোটা বিষয়টিকে মাপা যেতে পারে? চিকিৎসা করতে গিয়ে রোগীর পরিপ্রেক্ষিত বিচার না করা হলে সে চিকিৎসা কি মানবিক? গুণ নিরূপণ করতে গেলে সে চিকিৎসা ভাল না মন্দ? ভাল চিকিৎসার "ভাল" ব্যাপারটি কাকে বলে? অন্যদিকে  কিভাবে ভাল চিকিৎসা-প্রতিষ্ঠান চিনব? কিভাবে ভাল স্বাস্থ্য ব্যবস্থাকে চিহ্নিত করব? কিভাবে চিকিৎসার মান নিরূপণ শুধু নয়, মাপযোক করব? এই বিষয়টি নিয়ে আলোচনাই এই লেখার উদ্দেশ্য।চিকিৎসা ব্যবস্থার ও চিকিৎসার গুণমান কেন বিচার করব?আমাদের সকলের -- রোগী, চিকিৎসক, নার্স, অন্যান্য স্বাস্থ্য পরিষেবা যাঁরা দিই, এমনকি সরকারের পরিপ্রেক্ষিতেও, চিকিৎসা-ব্যবস্থার গুণমান বিচার খুঁটিয়ে দেখার একটা প্রয়োজন আছে। আমরা সবসময় চিকিৎসা ব্যবস্থা থাকা সত্ত্বেও তার সহজে নাগাল  পাই না। প্রায়ই চিকিৎসা এত সময় ও অর্থ সাপেক্ষ হয়ে পড়ে, আমরা চিকিৎসা করাতে পারি না। আবার যখন পারি, তখন নিখুঁত কারিগরের হাতে সংবেদনহীন, নৈর্বক্তিক, ও আন্তরিকতাহীন চিকিৎসা আমাদের অনেককেই সহ্য করতে হয়। আমরা যারা রোগী, তারা প্রচুর সময় ও অর্থ ব্যয় করি; তা সত্ত্বেও যে চিকিৎসা  পরিষেবা আমরা পাই তাতে আমাদের কথা কতটুকু বিচার বিবেচনা করা হয়?চিকিৎসা পরিষেবার কথা বললে তিনটি স্তরে "চিকিৎসার" কথা বলা হয়। আমারদের দেশের পরিকাঠামোয় চিকিৎসা পরিষেবা তিনটি পৃথক স্তরে দেওয়া হয় -- প্রাথমিক, মাধ্যমিক, এবং বিশেষজ্ঞ-কেন্দ্রিক চিকিৎসা ব্যবস্থা। প্রাথমিক স্তরে মূলত প্রতিষেধ-মূলক চিকিৎসা বা পরিবার কেন্দ্রিক চিকিৎসার ব্যবস্থা করা হয় । আমাদের দেশে যাঁরা সাধারণ ডাক্তারবাবু, পারিবারিক ডাক্তার, পাড়ার ডাক্তার, "ডাক্তার কাকু/জেঠু", যাঁরা বরাবর আমাদের পরিবারের কাছাকাছি থেকে চিকিৎসা করেছেন, জ্বর জারি হলে প্রথমে তাঁদের কাছে যাওয়া হয়, টিকা দিতে হলে তাঁদের শরণাপন্ন হতে হয়, এ হল সেই স্তর। এঁদের পরে মাধ্যমিক স্তরে যে ধরণের পরিষেবা দেওয়া হয় তাতে অপেক্ষাকৃত জটিল অসুখের দ্রুত নির্ধারণ ও চিকিৎসা করার ব্যবস্থা করতে হবে। তা পারিবারিক চিকিৎসকরাও করতে পারেন, বা "সাধারণ" (এখানে সাধারণ বলতে বিশেষ রোগের হাসপাতাল নয় এরকম হাসপাতাল) হাসপাতালে গিয়ে চিকিৎসা করা যেতে পারে। এর মধ্যে ওষুধের মাধ্যমে চিকিৎসা, শল্য চিকিৎসা, স্ত্রীরোগ, ধাত্রীবিদ্যা সংক্রান্ত চিকিৎসা, শিশুদের চিকিৎসা পড়ে। সরকারী হাসপাতাল, বেসরকারী নার্সিং হোম, হাসপাতাল এই ধরণের জায়গায় মানুষ চিকিৎসা করাতে যান। এর পরবর্তী  স্তরে খুব জটিল রোগের বিশেষজ্ঞ স্তরের চিকিৎসা। প্রাথমিক বা মাধ্যমিক স্তরে রোগ সারানো না গেলে মানুষকে নানা ভাবে রোগমুক্তি বা বিশেষ ক্ষেত্রে অঙ্গ- প্রতিস্থাপনার বন্দোবস্ত করা, জটিল অস্ত্রোপচার, এই ধরণের চিকিৎসা এর লক্ষ্য। এই ধরণের চিকিৎসা প্রযুক্তিগত দিক থেকে জটিল ও ব্যয়সাপেক্ষ, এর চিকিৎসা বিশেষজ্ঞরা করবেন। যে হাসপাতালে সেই চিকিৎসা হবে, তাকে স্পেশালিটি বা সুপার-স্পেশালিটি হাসপাতাল বলা হয়। ভারতে সরকারী স্বাস্থ্য দপ্তরের মানুষের কাছে স্বাস্থ্য পরিষেবার পৌঁছনর দায়িত্ব থাকে, সরকার ও সমাজ এইরকম একটি পরিকাঠামোয় পরিষেবা দেবার ব্যবস্থা করেন । এখন প্রশ্ন, চিকিৎসা পরিষেবার মান নির্ধারণ করার সময় এই তিনটি স্তরকে কিভাবে বিবেচনা করব বা তাকে কিভাবে মাপব? গুণমান নির্ধারণ করার কিবা প্রয়োজন? দ্বিতীয় প্রশ্নটিতে আসা যাক।এক, মান নির্ধারণ না বিচার করতে শিখলে, আপনি যে-ই হোন, আপনি ঠকে যেতে পারেন, এমনকি আপনার প্রাণসংশয় অবধি হতে পারে। কোন চিকিৎসা-ব্যবস্থার মান ভাল, কোনটির মান আরো ভালো, এ বিষয়টি জটিল। আমরা রুগীরা বা তাঁদের বাড়ির লোকেরা কোন বিশেষ একটি স্বাস্থ্য-সংস্থা, বা কোন একটি রাজ্যের চিকিৎসা-ব্যবস্থা, কি কোন হাসপাতালকে হয়ত ওপর থেকে দেখে ভাবছি খুব ভাল, আসলে রোগী নিয়ে সেখানে ভর্তি হতে বা চিকিৎসা পেতে গিয়ে হয়রানির শিকার হতে হয়, ভুল চিকিৎসা হতে পারে, নষ্ট সময় ও অর্থদণ্ডের কথা না হয় ছেড়েই দিলাম । আবার অন্যদিকে কোন একটি চিকিৎসা প্রতিষ্ঠানটিকে মনে মনে খারাপ ভাবছি, হয়ত সেখানে কম পয়সায় চিকিৎসা হয়, সে হয়ত বাইরে থেকে দেখতে মামুলি, তাই তাকে প্রত্যাখ্যান করলাম, অথচ সেখানেই চিকিৎসা করাতে গেলে দেখতাম তারা অতি আন্তরিক ও খুব ভাল চিকিৎসা করে। আর কিছু না হোক, অনাবশ্যক অর্থদণ্ডের হাত থেকে রেহাই পেতাম। দুই, চিকিৎসকদের কথা ভেবে দেখুন। আজকাল ভারতে হাসপাতালের ডাক্তারদের, বা প্রাইভেট প্র্যাকটিস করেন, এমন ডাক্তারদের, রোগীর বাড়ির লোকেরা বা আপামর জনসাধারণ গায়ে হাত তুলছে,  এ ধরণের অন্যায়, দুঃখজনক সংবাদ ইদানীং শোনা যাচ্ছে \cite{Ambesh2016749}। সংবাদপত্রের খবরে বহু ক্ষেত্রে দেখা যায় ডাক্তারবাবু যে চিকিৎসা করেছেন তাতে কোন ভুল নেই, তবুও তাঁকে অত্যাচার সহ্য করতে হচ্ছে । ডাক্তারবাবু ভাবছেন তিনি তাঁর জ্ঞানবুদ্ধিঅভিজ্ঞতা-প্রসূত, সাধ্যমত চিকিৎসা করেছেন, অভিজ্ঞতা ও প্রমাণের ভিত্তিতে যা চিকিৎসা তিনি করেছেন, উন্নত মানের চিকিৎসা বিচার করতে গেলে এইটুকুই যথেষ্ট। ডাক্তারের পক্ষে চিকিৎসা কতটা খরচসাপেক্ষ বা রোগী-চিকিৎসাকারী দলের পারস্পরিক সম্পর্ক বা রোগীদের রোগ নিয়ে অবহিত করা, তাদের সহজ ভাষায় বুঝিয়ে বলার ব্যাপারটি তাঁর চিকিৎসক সত্তা দিয়ে বিচার করলে গৌণ বলে মনে হবে। চিকিৎসার জটিল দিক, কারিগরি দিকটি তিনি ভাল বোঝেন, সেটিই তাঁর লক্ষ্য । অথচ চিকিৎসা ত্রুটিহীন হওয়া সত্ত্বেও তাঁকে রোগীপক্ষের অসন্তোষের শিকার হতে হল, এমনও হতে পারে তিনি হয়ত রোগীর সঙ্গে  যথেষ্ট ভদ্র ও সঙ্গত আচরণ করলেন, কিন্তু চিকিৎসাকারী দলের অন্যান্য সদস্য বা অন্যান্যরা রোগীর পরিবার বা রোগীর সঙ্গে অশিষ্ট আচরণ করাতে রোগীর বাড়ির লোক অসন্তুষ্ট হলেন, সব মিলিয়ে চিকিৎসার যাবতীয় দায়, রোগী ও তাঁর বাড়ির লোকের রোষ, বেচারা ডাক্তারবাবুর ঘাড়ে পড়ল, যেহেতু চিকিৎসা পরিষেবার তিনিই মুখ \cite{Madhiwalla_2006} । ডাক্তারবাবু চিকিৎসার মান একরকম করে ভেবেছেন, রোগী আর তাঁর বাড়ির লোকেদের চোখে সেই চিকিৎসার গুণমান আরেক রকম হয়ে দাঁড়িয়েছে। অতএব ডাক্তার ও রোগীর পক্ষ থেকে চিকিৎসার গুণের মাণ নির্ধারণের, বিশেষ করে মাপজোক করার তাগিদ আছে যাতে করে অন্তত এইটুকু বোঝা যায় যে, চিকিৎসার সামগ্রিক মানের দিক থেকে বিচার করলে কোনটি যথেষ্ট উচ্চমানের ও কোনটি নিম্নমানের তার একটা সাধারণের গ্রহণযোগ্য ব্যবস্থা থাকা উচিৎ, সে চিকিৎসার ফলাফল যাই হোক না কেন। এখানে তিনটি বিষয় বিবেচনা করার আছে। এক, ডাক্তারবাবুর দিক থেকে চিকিৎসার গুণমান শুধু রোগমুক্তি বা যথাযথ চিকিৎসা দিয়ে বিচার বিবেচনা করলে যথেষ্ট হবে না, আরো কিছু বিষয় ভেবে দেখতে হবে। দুই, চিকিৎসা কি স্বাস্থ্যের মান নিরূপণের ক্ষেত্রে আমরা প্রায়ই সরকারী, বেসরকারী, আন্তর্জাতিক, নানারকম পরিসংখ্যানের সাহায্য নিই। পাঁচ বছর বয়সের কম বয়সী শিশু মৃত্যু, বা চিকিৎসক-পিছু কত শয্যা, সেই সংখ্যার নিরিখে গোটা স্বাস্থ্যব্যবস্থার সামগ্রিক মান নিরূপণের একটা আবছা ছবি আমরা পাই। চিকিৎসা/স্বাস্থ্য ব্যবস্থার মান নির্ধারণ করতে গিয়ে তাতে কিছুটা আন্দাজ পাওয়া যেতে পারে হয়ত, তবে সে নেহাতই মোটা দাগের মাপ। এই ধরণের পরিমাপ যেহেতু সামগ্রিক তথ্য পরিসংখ্যান দিয়ে করা হয়, তাতে ব্যক্তিবিশেষের ক্ষেত্রে কি প্রযোজ্য তা বোঝা যাবে না । তিন, রোগীর পরিপ্রেক্ষিত বাদ দিয়ে রোগ নিদানের গুণমান বিচার করা এক্ষেত্রে  অর্থহীন। রোগমুক্তির বিচার যাঁরা রোগের পরিষেবা দেন, বা রোগীর পরিপ্রেক্ষিত বাদ দিয়ে করবেন কি করে? আর করবেনই বা কেন? গুণমানের মাপযোকের ব্যাপারটি আলোচনার করার আগে আরো দুটো কথা বলার আছে -- এক, স্বাস্থ্য বা চিকিৎসা ব্যবস্থার শরিকদের চিনে নিতে হবে, আর দুই, পরিকাঠামো বলতে কি বোঝাতে চাইছি সেটি স্পষ্ট হওয়া চাই।