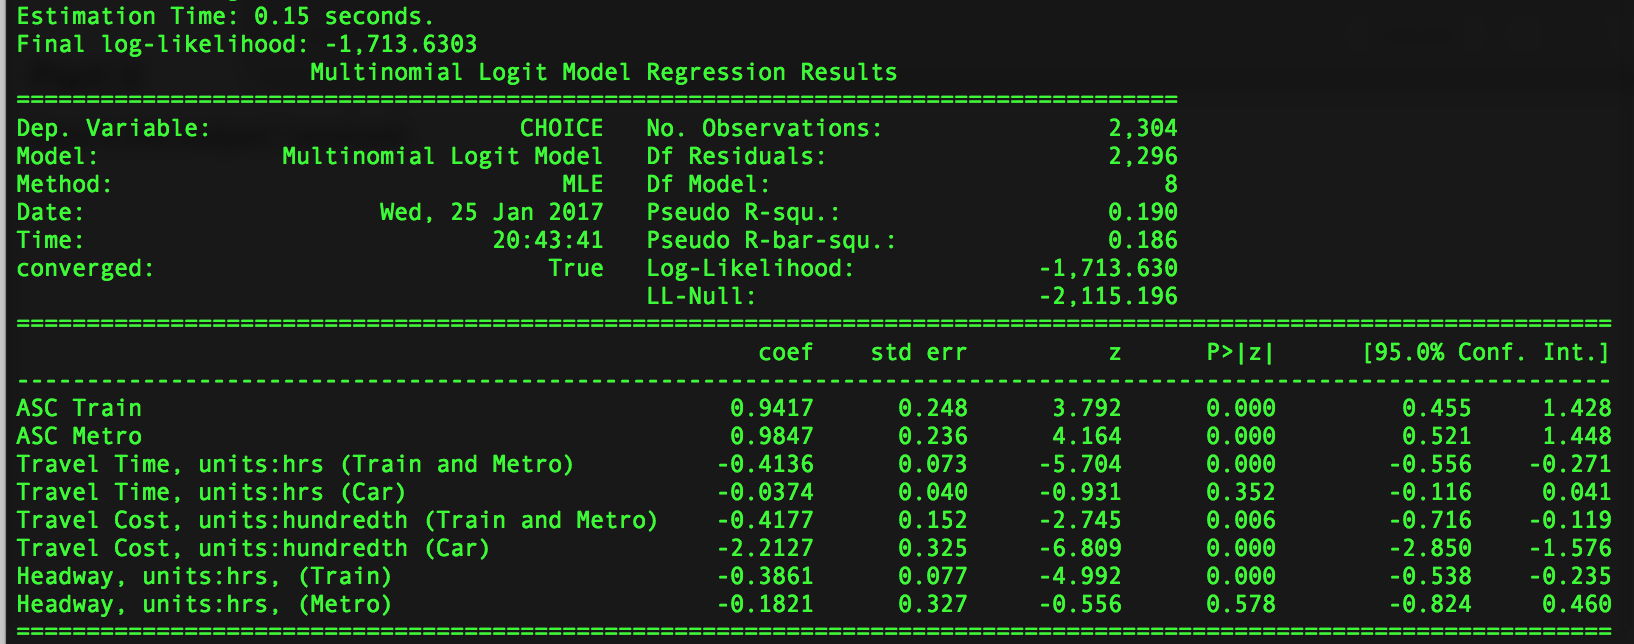
Research Project BrainstormingResearch QuestionGovernment agencies, utilities and private companies are trying to shave down the peak electrical load in California to reduce the amount of time that dirty and expensive "peaker plants" are running. One approach is to incentivize electricity consumers to transfer some of their demand during "critical-peak" (CP) events to less electricity-intensive "off-peak" hours, otherwise known as demand response. My research question is the following: How much do two residential demand response incentives - "SmartRate" from PG&E and "OhmHours" from the private company OhmConnect - reduce net CO2 emissions in California ? Desired Numerical ResultI want to know the difference in emissions (in tons of CO2) that can be attributed to each of these "critical-peak pricing" (CPP) programs. It may also be valuable to normalize this number based on some eligible and/or informed population. In other words, a metric like "CO2 emissions reduction per eligible customer", might help compare the efficacy of the two programs.Anticipated Behavioral ResponseThere are multiple points in the cascade of events that occur between the offering of these programs to a population and the programs' ultimate impact on CO2 emissions.First, there is only a portion of the population eligible for these programs who are actually aware of them. A 2014 study suggested 50% of Americans are unsure if their utility offered such programs \cite{parago_turn_2014}. Increased promotion of the program may help reach a greater number of customers and reduce this unaware proportion.Second, even if aware, some users may be comfortable with their existing energy bills and might not want to go through the effort to estimate how much money they could save with one of these programs and how much they would be inconvenienced by shifting their peak loads. In other words, for many people, the assumption of rational expectation may not hold and they may not enroll in these programs regardless of available information and cost:benefit ratio. Some of these users might be swayed by increased promotion of the potential benefits of the program, but others are not likely to switch. The \cite{parago_turn_2014} survey found that 87% of respondents claimed that they would participate in a demand response program, given the right incentives.Third, some of the residential electricity consumers who are willing to perform a calculation of utility (formally or informally) may base their decision to enroll or not enroll purely on the expected financial benefit, while others may enroll for environmental reasons. In other words, individual preferences may vary widely, especially with respect to the economic value they place on personal CO2 emissions. Notably, the \cite{parago_turn_2014} study found 84% of respondents were motivated by financial gain, and only 6% by environmental reasons. Socioeconomic status may influence this value by altering the utility that an individual derives from income. To address those concerned with economic impact, both PG&E and OhmConnect engage in some sort of "no loss" approach. For PG&E, if your first year of electricity bills is higher with SmartRate pricing than with their standard Time-of-Use (TOU) pricing, you will be refunded the difference. For OhmConnect, there is no way to lose money when you respond to their demand response events. Nevertheless, transaction costs could outweigh small economic benefits for some individuals. \cite{woolf_framework_2013} notes that transaction costs for many demand response programs are likely to be higher than energy efficiency programs, which typically require only a single upfront retrofit, rather than ongoing attention.Finally, if an individual or household does decide to enroll, countless factors will influence the degree to which they actively participate and alter their electricity use patterns. I would split these factors into two groups. The first group represents the factors that influence a consumer's likelihood to put forth the thought and effort to actively shift the timing of their electrical loads. Examples of this include the consumer's value of CO2 emissions and the amount of free time they possess. Several proxies might also get at factors influencing this likelihood. For example, a consumer's age might provide an indication of how "used to" the status quo of constant energy prices they might be and thus how easily they will remember to actively change their electricity use patterns. The second group represents the factors that influence the size of the potentially transferrable loads that a user might possess. For example, lighting is likely not easily shifted to other hours. If a user's main load during demand response events and/or peak pricing times is lighting, they are not likely to be able to meaningfully reduce their electricity usage. Heating/cooling loads are somewhat transferrable, in that you can pre-cool or pre-heat a house, cooking equipment (ovens, stoves, blenders, etc.) may or may not be transferrable, and other plug loads like washers and dryers are most likely to be transferrable. Household income may be a good proxy for the number of loads a customer possesses, which is likely correlated with the number of transferrable loads he/she possesses as well. However in some cases, estimates of appliance prevalence may provide more direct predictions of transferrable load than an income proxy. For example, \cite{gils_assessment_2014} uses such estimates to evaluate the cumulative load associated with residential heating, cooling, air conditioning, and washing/drying equipment in his evaluation of total DR potential in Europe. While such a study projects the theoretical upper bound of load shifting that could occur under full-participation DR scenarios, it does not attempt to also incorporate the behavioral factors that would provide more realistic estimates of the impact.Article ReviewTo my surprise, I found relatively little empirical behavioral research in the academic literature surrounding residential demand response initiatives. Much of the research focuses on technical or policy barriers to the introduction of programs without examining how people respond in areas where the programs are currently implemented \cite{eid_time-based_2016}. Perhaps this is because the programs are fairly new and a relatively small amount of data has been released. Regardless, the majority of the information on DR effectiveness comes from white papers, surveys, and electricity system models. One relevant peer-reviewed study, which provides a method for estimating counterfactual electricity use in the absence of a CPP, is \cite{herter_residential_2010}. It is seven years old, and the interim time between its publication and the present has seen an increase in DR programs; thus, it is likely that there are more recent, similar evaluations available that could take advantage of larger and/or newer datasets. However, in my limited literature review for this assignment, this article represented the best combination of relevance and publication timing.DomainThis article was published in 2010 in Energy, a journal that, unsurprisingly, deals with energy and electricity engineering and policy. Upon concluding the article, I discovered that the lead author is a 2016 graduate of the Energy and Resources Group (ERG), my department here at UC Berkeley. She focuses on policy and economics of electricity grids.SummaryOverview and Major FindingsThis article describes an analysis of the electricity usage of 438 households enrolled in a Summer 2004 pilot CPP program in California. It estimates the average load reduction during critical-peak hours for strata across 4 climate zones and three housing types (single-family high-use, single-family low-use, and multi-family), claiming to be the first study to examine heterogenous response to DR programs. They find that climate zone 4 (CZ4, or desert) households display the greatest absolute load reductions, while climate zone 1 (CZ1, coastal) households display the greatest reduction in percentage of total load. This result is seemingly intuitive as CZ4 households will have the greatest AC demand during the summer, but likely cannot reduce their AC as much as CZ1 households during critical-peaks due to uncomfortably high ambient temperatures. The article also evaluates differential response to varying CPP prices, finding no significant difference in the two prices assigned in this pilot study. They suggest this finding as evidence of the saturation of the ability of consumers to transfer discretionary loads outside of peak hours, even at moderate price signals. Finally, they claim to be the first study to show empirical evidence of "load-shifting", in that they find a significant increase in load during the hours and days before and after a CPP event, roughly balancing the decrease during the event.MethodologyWhile this study does not evaluate the behavioral factors influencing the level of response to CPP events, they do attempt to differentiate responses across strata, as indicated above. To do this, they run a separate multiple linear regression for each individual in the study, regressing electricity use in a given hour on variables accounting for hour-of-day, day-of-week, and month-of-year in each of four cases - baseline, day before CPP event, day of CPP event, and day after CPP event. With this regression, they can estimate a counterfactual "baseline" usage for each individual assuming that no CPP event was called, as well as a prediction of their usage immediately before, during, and after an event. Their main result at the individual level consists of the difference between baseline and each of the three "before, during, and after" CPP cases. They average this difference across individuals according to the different household-climate zone strata and then separately according to CPP price level.Major FindingsA population-weighted average response to CPP events of 0.07 kilowatts (kW), or 5.1% of total loadDifferential responses across climate zones and household type, with multi-family households in CZ1 and single-family, high-use households in CZ4 showing the largest responsesLack of a significantly different response between $.50/kWh and $.68/kWh CPP event pricesEvidence of significantly increased loads during the hours before and, especially, after CPP eventsCritiqueThis article represents the first attempt to examine heterogenous responses to residential DR programs, which begins to answer the policy-relevant question of "who should be most targeted for these programs." The differential responses across climate zones and household types are in some ways intuitive and in others novel, providing an initial result that deserves further research and scrutiny. Additionally, the finding of a saturated response at $.50/kWh is unexpected and, again, suggests that the question of DR elasticity deserves further research. Overall, I was not convinced by the methodology of this study. Notably, they estimate over 125 parameters in their regression for each individual, utilizing a dataset that contains roughly 2000 hourly observations per person. The possibility of overfitting is not tested using out-of-sample performance, and the predicted usage averaged across all individuals is suspiciously similar to the actual usage. The confidence intervals reported on their baseline and CPP event usage are quite small and show significance even for some unexpected findings. For example, they show a second significant decrease in electricity usage during the mornings after a CPP event. There may be an explanation for this, but the model may also be fitting noise. It would be nice to see some out-of-sample model validation results.Insight to research questionThis study asks the question: "how well does demand response work for customers that are regularly participating in such a program?" To focus on this question, they only examined customers who participated in 8 or more of the 12 CPP events called during their study period. This, in itself, is a valid and important research question but differs slightly from mine in that I seek to also examine the behavioral factors contributing to whether an individual will choose to enroll in such a program and, if so, whether he/she will choose to actively participate in the events. This article does provide motivation for further research into the drivers of heterogeneous response by showing evidence of large differences in responses across household-climate zone strata. It also demonstrates one method for elucidating heterogeneous response characteristics - that of individual level regressions, followed by averaging the estimated individual responses across strata. They use a highly parametric (or "data model") approach, defining a priori the model structure and the strata across which they will average. I would be interested in comparing their results to those observed when fitting a more flexible, algorithmic model that is tuned to optimize out-of-sample performance. In my mind, the latter approach would increase the credibility of the findings. Nevertheless, their method could serve as a baseline approach with which to test the behavioral factors influencing both enrollment and participation in various DR programs.Getting up and Running with PylogitHere is the output I obtained from running 'code01.py':